
Few years ago I participated in Kirk Pepperdine Java performance tuning training. One of the greatest technical training which I have ever been! And also great opportunity to visit Crete :-) Let’s check what I remember from the training …
In this blog post I would like to show Artifactory memory utilization analysis. Before you start any tuning you have to gather some statistics. You can’t tune application if you don’t know what should be improved.
Get basic information about OS where Artifactory is deployed and run using Linux /proc subsystem:
1
2
3
4
5
$cat /proc/cpuinfo | grep processor
processor       : 0
processor       : 1
processor       : 2
processor       : 3
1
2
$cat /proc/meminfo |grep MemTotal
MemTotal:      8163972 kB
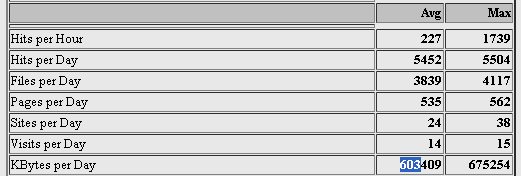
Collect HTTP requests statistics from Apache request logs (Apache is configured in front of Artifactory):
Verify current JVM version and startup parameters:
1
2
3
4
$java -version
java version "1.6.0_45"
Java(TM) SE Runtime Environment (build 1.6.0_45-b06)
Java HotSpot(TM) 64-Bit Server VM (build 20.45-b01, mixed mode)
1
2
3
4
5
6
7
$ps awx | grep java
-server -Xms2048m -Xmx2048m -Xss256k \
-XX:PermSize=256m -XX:MaxPermSize=256m \
-XX:NewSize=768m -XX:MaxNewSize=768m \
-XX:+UseParallelGC -XX:+UseParallelOldGC \
-XX:+PrintGCDetails -XX:+PrintGCTimeStamps -Xloggc:$CATALINA_HOME/logs/gc.log \
-Dartifactory.home=$ARTIFACTORY_HOME
Let me explain JVM parameters:
-server Force server mode for VM (instead of client mode.
-Xms2048m -Xmx2048m Set up initial and total heap size to 2GB, it’s recommended to set heap to fixed size. Default settings are too low for web applications (64MB if I remember).
-Xss256k Set stack memory size (256kB for each thread!)
-XX:PermSize=256m -XX:MaxPermSize=256m Set permanent generation size in similar way to heap size. Default settings are too low for web applications (64MB if I remember).
-XX:NewSize=768m -XX:MaxNewSize=768m One of the most important settings, increase young generation part of heap for short living objects, by default it’s 1/4 or even 1/8 of total heap size. Web application creates a huge number of short living objects.
-XX:+UseParallelGC -XX:+UseParallelOldGC Utilize multiple CPUs for garbage collection, it should decrease GC time.
-XX:+PrintGCDetails -XX:+PrintGCTimeStamps -Xloggc:$CATALINA_HOME/logs/gc.log Log all GC activities for further analysis.
Check GC log statistics with HPjmeter:
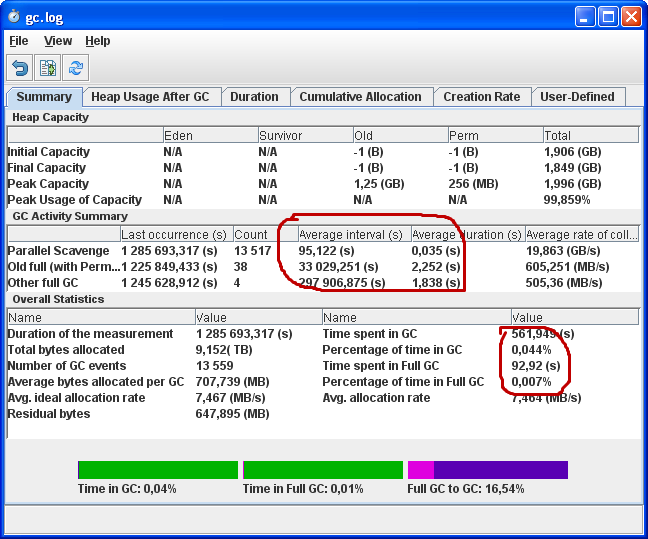
In the summary tab, you can find the average interval between GCs and average GC times. GC for young generation is called on every 95s for 35ms. Full GC takes 2.25s, but fortunately it’s called only ~three times per day (33 029 seconds). Great outcomes, you rather don’t have a chance to recognize GC “stop the world” pauses.
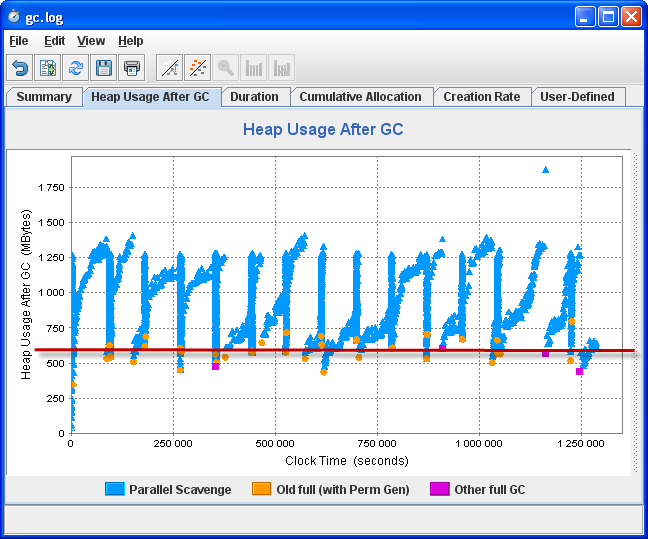
Based on the above graph, I could say that there is no memory leaks in Artifactory. After each full GC memory is freed to the same level. The peaks on the graph come from nightly jobs executed internally by Artifactory (indexer and backup).
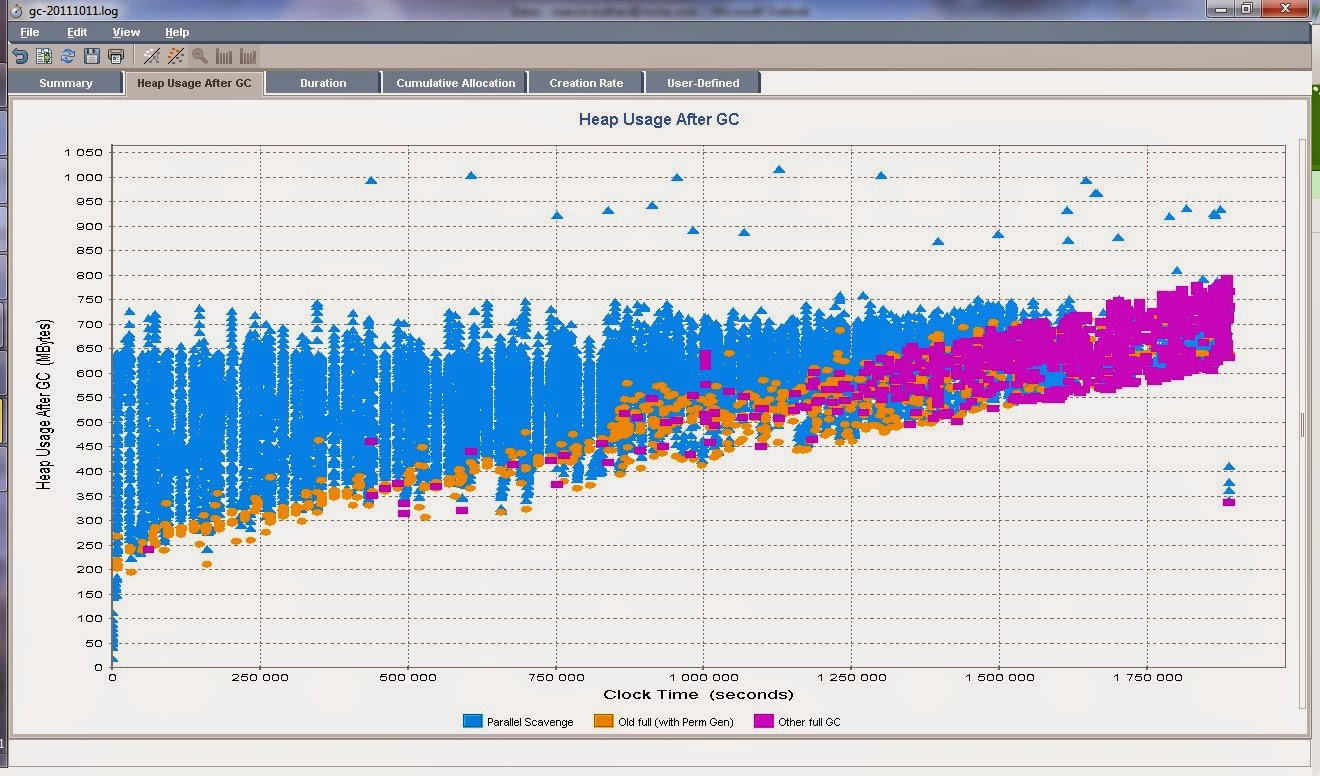
If you are interesting how memory leaks look like, below you can find example from Jira issue reported by me:
In general, heap size for young generation is enough to handle business hours requests without full GC!!! And the GC pauses for young generation are very short (30ms). After gathering baseline statistics I recognized that no further Artifactory tuning is needed :-)
Comments