
A long-running Spark Streaming job, once submitted to the YARN cluster should run forever until it’s intentionally stopped. Any interruption introduces substantial processing delays and could lead to data loss or duplicates. Neither YARN nor Apache Spark have been designed for executing long-running services. But they have been successfully adapted to growing needs of near real-time processing implemented as long-running jobs. Successfully doesn’t necessarily mean without technological challenges.
This blog post summarizes my experiences in running mission critical, long-running Spark Streaming jobs on a secured YARN cluster. You will learn how to submit Spark Streaming application to a YARN cluster to avoid sleepless nights during on-call hours.
Fault tolerance
In the YARN cluster mode Spark driver runs in the same container as the Application Master, the first YARN container allocated by the application. This process is responsible for driving the application and requesting resources (Spark executors) from YARN. What’s important, Application Master eliminates the need for other process that runs during the application lifecycle. Even if an edge Hadoop cluster node where the Spark Streaming job was submitted fails, the application stays unaffected.
To run Spark Streaming application in the cluster mode, ensure that the following parameters are given to spark-submit command:
1
spark-submit --master yarn --deploy-mode cluster
Because Spark driver and Application Master share a single JVM, any error in Spark driver stops our long-running job.
Fortunately it’s possible to configure the maximum number of attempts that will be made to re-run the application.
It’s reasonable to set a higher value than default 2 (derived from YARN cluster property yarn.resourcemanager.am.max-attempts).
For me 4 works quite well, higher values may cause unnecessary restarts even if the reason of the failure is permanent.
1
2
spark-submit --master yarn --deploy-mode cluster \
    --conf spark.yarn.maxAppAttempts=4
If the application runs for days or weeks without restart or redeployment on a highly utilized cluster, 4 attempts could be exhausted in a few hours. To avoid this situation, the attempt counter should be reset every hour or so.
1
2
3
spark-submit --master yarn --deploy-mode cluster \
    --conf spark.yarn.maxAppAttempts=4 \
    --conf spark.yarn.am.attemptFailuresValidityInterval=1h
Another important setting is a maximum number of executor failures before the application fails.
By default it’s max(2 * num executors, 3), well suited for batch jobs but not for long-running jobs.
The property comes with the corresponding validity interval which also should be set.
1
2
3
4
5
spark-submit --master yarn --deploy-mode cluster \
    --conf spark.yarn.maxAppAttempts=4 \
    --conf spark.yarn.am.attemptFailuresValidityInterval=1h \
    --conf spark.yarn.max.executor.failures={8 * num_executors} \
    --conf spark.yarn.executor.failuresValidityInterval=1h
For long-running jobs you could also consider boosting maximum number of task failures before giving up the job. By default tasks will be retried 4 times and then the job fails.
1
2
3
4
5
6
spark-submit --master yarn --deploy-mode cluster \
    --conf spark.yarn.maxAppAttempts=4 \
    --conf spark.yarn.am.attemptFailuresValidityInterval=1h \
    --conf spark.yarn.max.executor.failures={8 * num_executors} \
    --conf spark.yarn.executor.failuresValidityInterval=1h \
    --conf spark.task.maxFailures=8
Performance
When a Spark Streaming application is submitted to the cluster, the YARN queue where the job runs must be defined. I strongly recommend using YARN Capacity Scheduler and submitting long-running jobs to separate queue. Without a separate YARN queue your long-running job will be preempted by a massive Hive query sooner or later.
1
2
3
4
5
6
7
spark-submit --master yarn --deploy-mode cluster \
    --conf spark.yarn.maxAppAttempts=4 \
    --conf spark.yarn.am.attemptFailuresValidityInterval=1h \
    --conf spark.yarn.max.executor.failures={8 * num_executors} \
    --conf spark.yarn.executor.failuresValidityInterval=1h \
    --conf spark.task.maxFailures=8 \
    --queue realtime_queue
Another important issue for Spark Streaming jobs is keeping processing time stable and highly predictable. Processing time should stay below batch duration to avoid delays. I’ve found that Spark speculative execution helps a lot, especially on a busy cluster. Batch processing times are much more stable when speculative execution is enabled. Unfortunately speculative mode can be enabled only if Spark actions are idempotent.
1
2
3
4
5
6
7
8
spark-submit --master yarn --deploy-mode cluster \
    --conf spark.yarn.maxAppAttempts=4 \
    --conf spark.yarn.am.attemptFailuresValidityInterval=1h \
    --conf spark.yarn.max.executor.failures={8 * num_executors} \
    --conf spark.yarn.executor.failuresValidityInterval=1h \
    --conf spark.task.maxFailures=8 \
    --queue realtime_queue \
    --conf spark.speculation=true
Security
On a secured HDFS cluster, long-running Spark Streaming jobs fail due to Kerberos ticket expiration. Without additional settings, Kerberos ticket is issued when Spark Streaming job is submitted to the cluster. When the ticket expires Spark Streaming job isn’t able to write or read data from HDFS anymore.
In theory (based on documentation) it should be enough to pass Kerberos principal and keytab as spark-submit command:
1
2
3
4
5
6
7
8
9
10
spark-submit --master yarn --deploy-mode cluster \
     --conf spark.yarn.maxAppAttempts=4 \
     --conf spark.yarn.am.attemptFailuresValidityInterval=1h \
     --conf spark.yarn.max.executor.failures={8 * num_executors} \
     --conf spark.yarn.executor.failuresValidityInterval=1h \
     --conf spark.task.maxFailures=8 \
     --queue realtime_queue \
     --conf spark.speculation=true \
     --principal user/hostname@domain \
     --keytab /path/to/foo.keytab
In practice, due to several bugs (HDFS-9276, SPARK-11182) HDFS cache must be disabled. If not, Spark will not be able to read updated token from file on HDFS.
1
2
3
4
5
6
7
8
9
10
11
spark-submit --master yarn --deploy-mode cluster \
     --conf spark.yarn.maxAppAttempts=4 \
     --conf spark.yarn.am.attemptFailuresValidityInterval=1h \
     --conf spark.yarn.max.executor.failures={8 * num_executors} \
     --conf spark.yarn.executor.failuresValidityInterval=1h \
     --conf spark.task.maxFailures=8 \
     --queue realtime_queue \
     --conf spark.speculation=true \
     --principal user/hostname@domain \
     --keytab /path/to/foo.keytab \
     --conf spark.hadoop.fs.hdfs.impl.disable.cache=true
Mark Grover pointed out that those bugs only affect HDFS clusters configured with NameNodes in HA mode. Thanks, Mark.
Logging
The easiest way to access Spark application logs is to configure Log4j console appender,
wait for application termination and use yarn logs -applicationId [applicationId] command.
Unfortunately it isn’t feasible to terminate long-running Spark Streaming jobs to access the logs.
I recommend installing and configuring Elastic, Logstash and Kibana (ELK stack). ELK installation and configuration is out of this blog post scope, but remember to log the following context fields:
- YARN application id
- YARN container hostname
- Executor id (Spark driver is always 000001, Spark executors start from 000002)
- YARN attempt (to check how many times Spark driver has been restarted)
Log4j’s configuration with Logstash specific appender and layout definition should be passed to spark-submit command:
1
2
3
4
5
6
7
8
9
10
11
12
13
14
spark-submit --master yarn --deploy-mode cluster \
     --conf spark.yarn.maxAppAttempts=4 \
     --conf spark.yarn.am.attemptFailuresValidityInterval=1h \
     --conf spark.yarn.max.executor.failures={8 * num_executors} \
     --conf spark.yarn.executor.failuresValidityInterval=1h \
     --conf spark.task.maxFailures=8 \
     --queue realtime_queue \
     --conf spark.speculation=true \
     --principal user/hostname@domain \
     --keytab /path/to/foo.keytab \
     --conf spark.hadoop.fs.hdfs.impl.disable.cache=true \
     --conf spark.driver.extraJavaOptions=-Dlog4j.configuration=file:log4j.properties \
     --conf spark.executor.extraJavaOptions=-Dlog4j.configuration=file:log4j.properties \
     --files /path/to/log4j.properties
Finally Kibana dashboard for Spark Job might look like:

Monitoring
Long running job runs 24/7 so it’s important to have an insight into historical metrics. Spark UI keeps statistics only for a limited number of batches, and after restart all metrics are gone. Again, external tools are needed. I recommend installing Graphite for collecting metrics and Grafana for building dashboards.
First, Spark needs to be configured to report metrics into Graphite, prepare the metrics.properties file:
1
2
3
4
5
6
7
*.sink.graphite.class=org.apache.spark.metrics.sink.GraphiteSink
*.sink.graphite.host=[hostname]
*.sink.graphite.port=[port]
*.sink.graphite.prefix=some_meaningful_name

driver.source.jvm.class=org.apache.spark.metrics.source.JvmSource
executor.source.jvm.class=org.apache.spark.metrics.source.JvmSource
And configure spark-submit command:
1
2
3
4
5
6
7
8
9
10
11
12
13
14
spark-submit --master yarn --deploy-mode cluster \
     --conf spark.yarn.maxAppAttempts=4 \
     --conf spark.yarn.am.attemptFailuresValidityInterval=1h \
     --conf spark.yarn.max.executor.failures={8 * num_executors} \
     --conf spark.yarn.executor.failuresValidityInterval=1h \
     --conf spark.task.maxFailures=8 \
     --queue realtime_queue \
     --conf spark.speculation=true \
     --principal user/hostname@domain \
     --keytab /path/to/foo.keytab \
     --conf spark.hadoop.fs.hdfs.impl.disable.cache=true \
     --conf spark.driver.extraJavaOptions=-Dlog4j.configuration=file:log4j.properties \
     --conf spark.executor.extraJavaOptions=-Dlog4j.configuration=file:log4j.properties \
     --files /path/to/log4j.properties:/path/to/metrics.properties
Metrics
Spark publishes tons of metrics from driver and executors.
If I were to choose the most important one, it would be the last received batch records.
When StreamingMetrics.streaming.lastReceivedBatch_records == 0 it probably means that Spark Streaming job has been stopped or failed.
Other important metrics are listed below:
- When total delay is greater than batch interval, latency of the processing pipeline increases.
1
driver.StreamingMetrics.streaming.lastCompletedBatch_totalDelay
- When number of active tasks is lower than
number of executors * number of cores, allocated YARN resources aren’t fully utilized.
1
executor.threadpool.activeTasks
- How much RAM is used for RDD cache?
1
driver.BlockManager.memory.memUsed_MB
- When there isn’t enough RAM for RDD cache, how much data has been spilled to disk?
You should increase executor memory or change
spark.memory.fractionSpark property to avoid performance degradation.
1
driver.BlockManager.disk.diskSpaceUsed_MB
- What’s JVM memory utilization on Spark driver?
1
2
3
4
5
driver.jvm.heap.used
driver.jvm.non-heap.used
driver.jvm.pools.G1-Old-Gen.used
driver.jvm.pools.G1-Eden-Space.used
driver.jvm.pools.G1-Survivor-Space.used
- How much time is spent on GC on Spark driver?
1
2
driver.jvm.G1-Old-Generation.time
driver.jvm.G1-Young-Generation.time
- What’s JVM memory utilization on Spark executors?
1
2
3
4
5
[0-9]*.jvm.heap.used
[0-9]*.jvm.non-heap.used
[0-9]*.jvm.pools.G1-Old-Gen.used
[0-9]*.jvm.pools.G1-Survivor-Space.used
[0-9]*.jvm.pools.G1-Eden-Space.used
- How much time is spent on GC on Spark executors?
1
2
[0-9]*.jvm.G1-Old-Generation.time
[0-9]*.jvm.G1-Young-Generation.time
Grafana
While you configure first Grafana dashboard for Spark application, the first problem pops up:
How to configure Graphite query when metrics for every Spark application run are reported under its own application id?
If you are lucky and brave enough to use Spark 2.1, pin the application metric into static application name:
1
--conf spark.metrics.namespace=my_application_name
For Spark versions older than 2.1, a few tricks with Graphite built-in functions are needed.
Driver metrics use wildcards .*(application_[0-9]+).*
and aliasSub Graphite function to present ‘application id’ as graph legend:
1
aliasSub(stats.analytics.$job_name.*.prod.$dc.*.driver.jvm.heap.used, ".*(application_[0-9]+).*", "heap: \1")
For executor metrics again use wildcards .*(application_[0-9]+).*,
groupByNode Graphite function to sum metrics from all Spark executors
and finally aliasSub Graphite function to present ‘application id’ as graph legend:
1
aliasSub(groupByNode(stats.analytics.$job_name.*.prod.$dc.*.[0-9]*.jvm.heap.used, 6, "sumSeries"), "(.*)", "heap: \1")
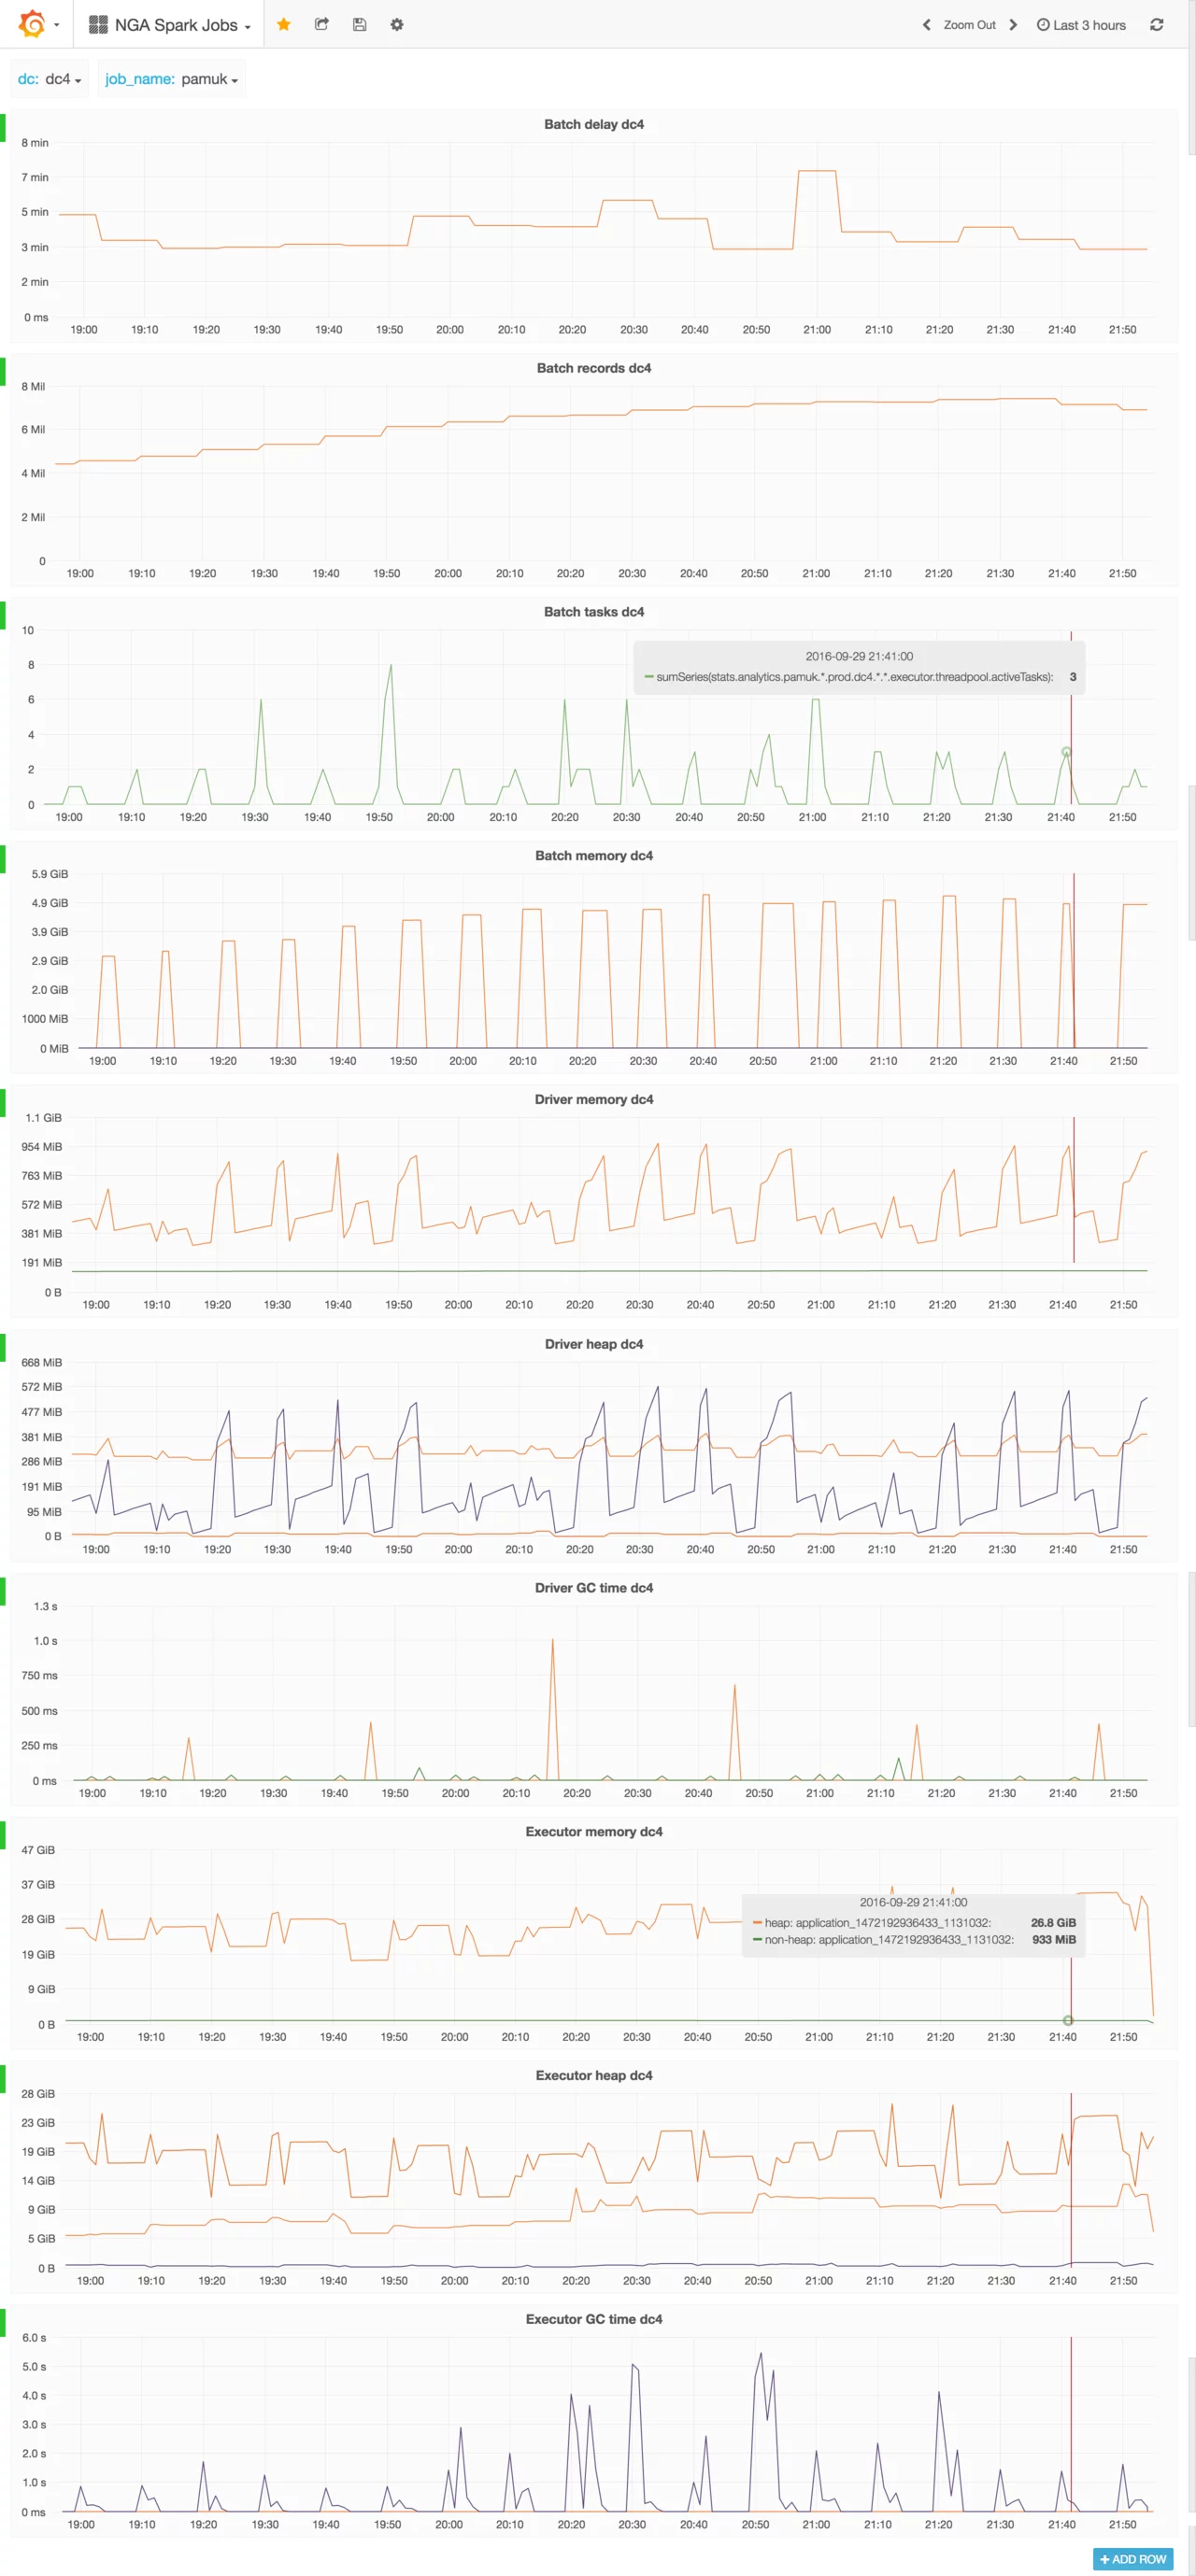
Finally Grafana dashboard for Spark Job might look like:
If Spark application is restarted frequently, metrics for old, already finished runs should be deleted from Graphite. Because Graphite doesn’t compact inactive metrics, old metrics slow down Graphite itself and Grafana queries.
Graceful stop
The last puzzle element is how to stop Spark Streaming application deployed on YARN in a graceful way.
The standard method for stopping (or rather killing) YARN application is using a command yarn application -kill [applicationId].
And this command stops the Spark Streaming application but this could happen in the middle of a batch.
So if the job reads data from Kafka, saves processing results on HDFS and finally commits Kafka offsets
you should expect duplicated data on HDFS when job was stopped just before committing offsets.
The first attempt to solve the graceful shutdown issue was to call Spark streaming context stop method in a shutdown hook.
1
2
3
sys.addShutdownHook {
    streamingContext.stop(stopSparkContext = true, stopGracefully = true)
}
Disappointingly a shutdown hook is called too late to finish the started batch and the Spark application is killed almost immediately. Moreover there is no guarantee that a shutdown hook will be called by JVM at all.
At the time of writing this blog post the only confirmed way to gracefully shutdown Spark Streaming application on YARN
is to notify somehow the application about planned shutdown, and then stop streaming context programmatically (but not from shutdown hook).
Command yarn application -kill should be used only as a last resort if notified application didn’t stop after defined timeout.
The application can be notified about planned shutdown using a marker file on HDFS (the easiest way), or using a simple Socket/HTTP endpoint exposed on the driver (sophisticated way).
Because I like KISS principle, below you can find shell script pseudo-code for starting / stopping Spark Streaming application using marker file:
1
2
3
4
5
6
7
8
9
10
11
12
13
14
15
16
17
18
19
20
start() {
    hdfs dfs -touchz /path/to/marker/my_job_unique_name
    spark-submit ...
}

stop() {
    hdfs dfs -rm /path/to/marker/my_job_unique_name
    force_kill=true
    application_id=$(yarn application -list | grep -oe "application_[0-9]*_[0-9]*"`)
    for i in `seq 1 10`; do
        application_status=$(yarn application -status ${application_id} | grep "State : \(RUNNING\|ACCEPTED\)")
        if [ -n "$application_status" ]; then
            sleep 60s
        else
            force_kill=false
            break
        fi
    done
    $force_kill && yarn application -kill ${application_id}
}
In the Spark Streaming application, the background thread should monitor the marker file,
and when the file disappears stop the context calling streamingContext.stop(stopSparkContext = true, stopGracefully = true).
Summary
As you could see, configuration for the mission critical Spark Streaming application deployed on YARN is quite complex. It has been a long, tedious and iterative learning process of all presented techniques by a few very smart devs. But at the end, long-running Spark Streaming applications deployed on highly utilized YARN clusters are extraordinarily stable.
Comments