
When you deploy any non-trivial data pipelines using complex infrastructure you should expect some troubles sooner or later.
- The pipeline could slow down
- Resources usage could be higher than usual
- For batch processing the throughput might be lower
- For real-time processing the overall latency might be higher
Today you will learn how to find the root cause of the performance problems in data pipelines deployed on Google Cloud Platform.
The story
A few days ago on-duty engineer in my team reported some issues for Spark jobs deployed on Dataproc clusters. Large jobs got timeouts from the Cloud Composer, the smaller ones finished successfully, but it took 4-5 times longer than usual.
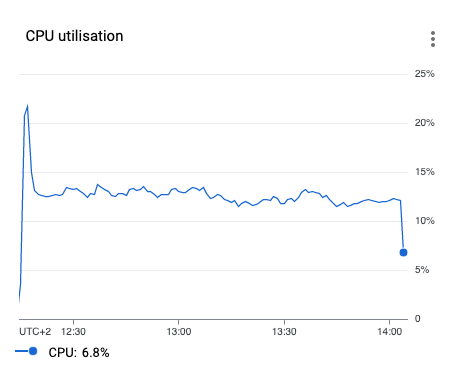
After quick analysis we found that CPU utilization for Dataproc ephemeral cluster is fairly low:
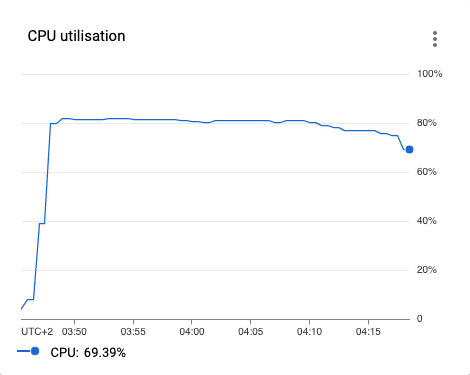
For comparison, the same job on the same data before the incident:
What could we do? Open a ticket to the Dataproc support that we observe degradation of managed service?
Wrong! If the root cause of the issue isn’t in Dataproc itself, Dataproc support doesn’t help.
When you fill the ticket for given Google Cloud Platform service (e.g. Dataproc), the support takes a look at internal metrics and logs of this service. The support doesn’t know anything about your Spark jobs deployed on the Dataproc cluster. So if the root cause of the issue is in another part of Google Cloud Platform ecosystem, Dataproc support is … useless.
Troubleshooting
We know that our Spark jobs read data from BigQuery using Storage Read API, make some transformations and save the results to Cloud Storage.
If the job isn’t able to read data at full speed, the CPU utilization will be low. It could be a Storage Read API issue or some network issue between Dataproc cluster and BigQuery.
Fortunately, almost every Google Cloud Platform API provides the following metrics:
- Request latency
- Requests count with response status details
- Request size
- Response size
Let’s look at Storage Read API latency metrics:
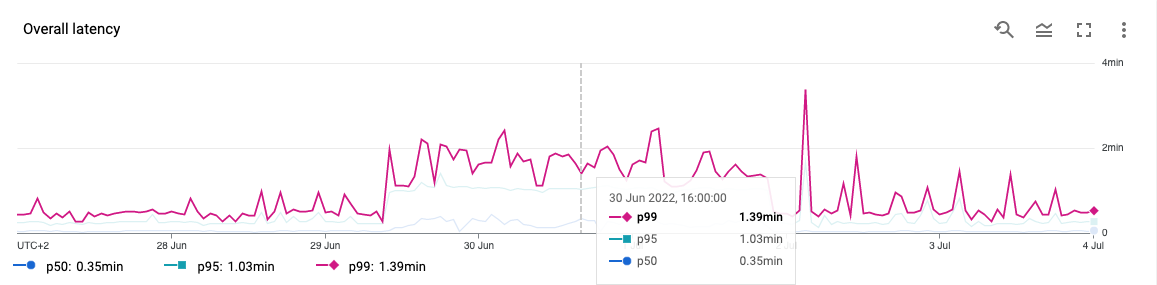
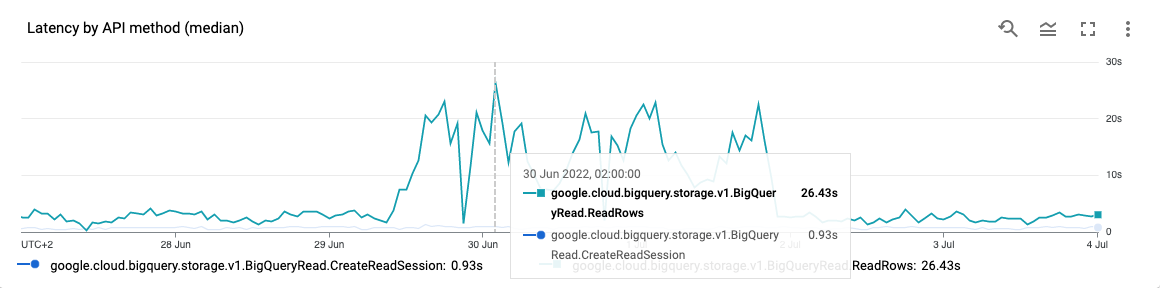
The strong evidence that the root cause of the Spark job slowness isn’t in Dataproc but in BigQuery service!
We filled a ticket to the BigQuery support, and quickly got confirmation that there is the global issue. It was a problem with the latest change in “Global BigQuery Router” (whatever it is). The change had been rolled back after 2 days, and it solved the issue with our Spark jobs on the Dataproc cluster.
Custom dashboards
The built-in dashboards for API metrics are quite good, but I would strongly recommend preparing dedicated dashboards for selected APIs only. We defined reusable Terraform module for creating the custom dashboard for API metrics:
1
2
3
4
5
resource "google_monitoring_dashboard" "dashboard" {
  dashboard_json = templatefile("${path.module}/templates/api.json",
    { title = var.title, service = var.service, method = var.method }
  )
}
Dashboard template:
1
2
3
4
5
6
7
8
9
10
11
12
13
14
15
16
17
18
19
20
21
22
23
24
25
26
27
28
29
30
31
32
33
34
35
36
37
38
39
40
41
42
43
44
45
46
47
48
49
50
51
52
53
54
55
56
57
58
59
60
61
62
63
64
65
66
67
68
69
70
71
72
73
74
75
76
77
78
79
80
81
82
83
84
85
86
87
88
89
90
91
92
93
94
95
96
97
98
99
100
101
102
103
104
105
106
107
108
109
110
111
112
113
114
115
116
117
118
119
120
121
122
123
124
125
126
127
128
129
130
131
{
  "displayName": "Consumed API (${title})",
  "gridLayout": {
    "columns": "2",
    "widgets": [
      {
        "title": "Requests latencies",
        "xyChart": {
          "dataSets": [
            {
              "timeSeriesQuery": {
                "timeSeriesFilter": {
                  "filter": "metric.type=\"serviceruntime.googleapis.com/api/request_latencies\" resource.type=\"consumed_api\" resource.label.\"service\"=\"${service}\" resource.label.\"method\"=\"${method}\"",
                  "aggregation": {
                    "alignmentPeriod": "60s",
                    "perSeriesAligner": "ALIGN_SUM",
                    "crossSeriesReducer": "REDUCE_SUM"
                  }
                }
              },
              "plotType": "HEATMAP",
              "minAlignmentPeriod": "60s",
              "targetAxis": "Y1"
            }
          ],
          "timeshiftDuration": "0s",
          "yAxis": {
            "label": "y1Axis",
            "scale": "LINEAR"
          },
          "chartOptions": {
            "mode": "COLOR"
          }
        }
      },
      {
        "title": "Requests count",
        "xyChart": {
          "dataSets": [
            {
              "timeSeriesQuery": {
                "timeSeriesFilter": {
                  "filter": "metric.type=\"serviceruntime.googleapis.com/api/request_count\" resource.type=\"consumed_api\" resource.label.\"service\"=\"${service}\" resource.label.\"method\"=\"${method}\"",
                  "aggregation": {
                    "alignmentPeriod": "60s",
                    "perSeriesAligner": "ALIGN_MEAN",
                    "crossSeriesReducer": "REDUCE_MEAN",
                    "groupByFields": [
                      "metric.label.\"response_code\""
                    ]
                  }
                }
              },
              "plotType": "LINE",
              "minAlignmentPeriod": "60s",
              "targetAxis": "Y1"
            }
          ],
          "timeshiftDuration": "0s",
          "yAxis": {
            "label": "y1Axis",
            "scale": "LINEAR"
          },
          "chartOptions": {
            "mode": "COLOR"
          }
        }
      },
      {
        "title": "Request sizes",
        "xyChart": {
          "dataSets": [
           {
              "timeSeriesQuery": {
                "timeSeriesFilter": {
                  "filter": "metric.type=\"serviceruntime.googleapis.com/api/request_sizes\" resource.type=\"consumed_api\" resource.label.\"service\"=\"${service}\" resource.label.\"method\"=\"${method}\"",
                  "aggregation": {
                    "alignmentPeriod": "60s",
                    "perSeriesAligner": "ALIGN_PERCENTILE_95",
                    "crossSeriesReducer": "REDUCE_SUM"
                  }
                }
              },
              "plotType": "LINE",
              "minAlignmentPeriod": "60s",
              "targetAxis": "Y1"
            }
          ],
          "timeshiftDuration": "0s",
          "yAxis": {
            "label": "y1Axis",
            "scale": "LINEAR"
          },
          "chartOptions": {
            "mode": "COLOR"
          }
        }
      },
      {
        "title": "Response sizes",
        "xyChart": {
          "dataSets": [
            {
              "timeSeriesQuery": {
                "timeSeriesFilter": {
                  "filter": "metric.type=\"serviceruntime.googleapis.com/api/response_sizes\" resource.type=\"consumed_api\" resource.label.\"service\"=\"${service}\" resource.label.\"method\"=\"${method}\"",
                  "aggregation": {
                    "alignmentPeriod": "60s",
                    "perSeriesAligner": "ALIGN_PERCENTILE_95",
                    "crossSeriesReducer": "REDUCE_SUM"
                  }
                }
              },
              "plotType": "LINE",
              "minAlignmentPeriod": "60s",
              "targetAxis": "Y1"
            }
          ],
          "timeshiftDuration": "0s",
          "yAxis": {
            "label": "y1Axis",
            "scale": "LINEAR"
          },
          "chartOptions": {
            "mode": "COLOR"
          }
        }
      }
    ]
  }
}
Terraform module usage:
1
2
3
4
5
6
7
8
9
10
11
12
13
14
15
module "dashboard_api_bq_storage_read" {
  source = "modules/monitoring-dashboard-api"

  title = "BQ Storage Read"
  service = "bigquerystorage.googleapis.com"
  method = "google.cloud.bigquery.storage.v1.BigQueryRead.ReadRows"
}

module "dashboard_api_bq_streaming_inserts" {
  source = "modules/monitoring-dashboard-api"

  title = "BQ Streaming Inserts"
  service = "bigquery.googleapis.com"
  method = "google.cloud.bigquery.v2.TableDataService.InsertAll"
}
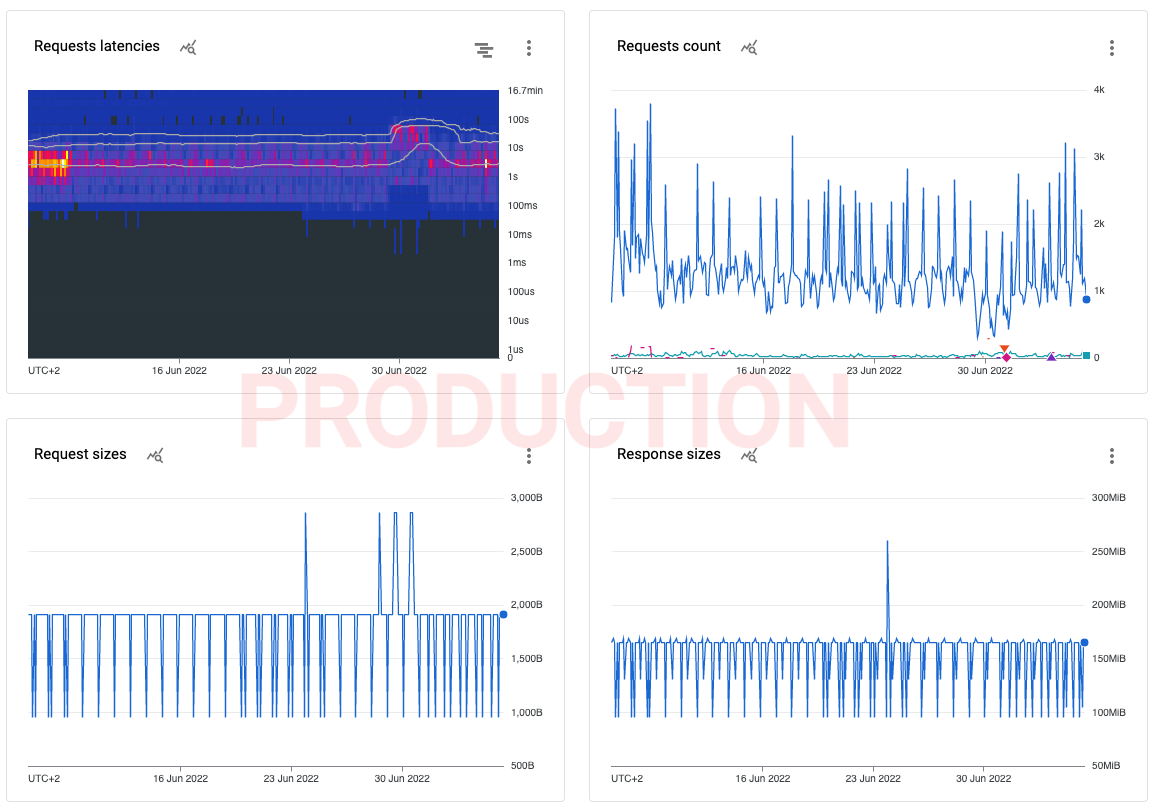
Final dashboard for ReadRows method in Storage Read API.
- Latency heatmap with percentiles (50th, 95th and 99th)
- Request count grouped by response status to see if there are errors
- Request and response sizes, it gives an information about batching
Summary
Key takeaways:
- Distributed systems troubleshooting is hard, especially for managed service in the public cloud
- Ensure that you found the root cause of the problem before you open the support ticket
- Be prepared, monitor metrics of the most important Google Cloud APIs
Comments