
Do you check costs of the data pipelines in exactly the same way as you check overall health, latency or throughput? Nowadays, taking care of cost efficiency is an integral part of every data engineer job. I would like to share my own experiences with applying FinOps discipline in the organization within tens of data engineering teams and thousands of data pipelines.
All my blog posts are based on practical experiences, everything is battle tested and all presented examples are taken from the real systems. And this time it won’t be different. On a daily basis I manage the analytical data platform, the project with $100k+ monthly budget. I will share how to keep costs of the streaming and batch pipelines on Google Cloud Platform under control.
FinOps overview
FinOps is a very broad term, but what’s especially important from a data engineer perspective?
- You take ownership of the cloud resources usage and costs. With the great power of the public cloud comes great responsibility.
- Cost is introduced as a regular metric of every data pipeline. More data and more processing power cause higher costs.
- To optimize the costs you have to know detailed billing of every cloud resource. It doesn’t make any sense to optimize the least expensive part of the system.
- Cost analysis becomes a part of definition of done. After major changes you should also check the billings for any regression.
- Premature cost optimization is the root of all evil. Develop, deploy, measure and then optimize if needed. Do you remember Donald Knuth’s paper about performance?
Google Cloud Platform resources
You may be surprised how complex Google Cloud Platform billing is. There are dozens of products, every product has tens of SKUs, hundreds of different elements to track and count. What are the most important cost factors in the Google Cloud Platform for data pipelines in my projects?
- Common resources
- vCPU
- Memory
- Persistent disks
- Local disks
- Network egress
- Dataflow
- Streaming Engine (for real-time pipelines)
- Shuffle Service (for batch pipelines)
- Dataproc
- Licensing Fee
- BigQuery
- Active, Long Term or Physical storage
- Analysis
- Streaming inserts
- Storage API
- Pubsub
- Message delivery basic
- Inter-region data delivery
- Topic/Subscription message backlog
- Cloud Storage
- Standard, Nearline, Coldline or Archive storage
- Class A operations
- Class B operations
- Data retrieval
- Early deletion
- Cloud Composer
- SQL vCPU time
- Environment fee
- Monitoring & Logging
- Metric Volume
- Log Volume
There are many other GCP products relevant to the data pipelines, so the cost structure could be different in your organization. I would also look at the following products, not used by me on a daily basis.
Resource oriented costs tracking
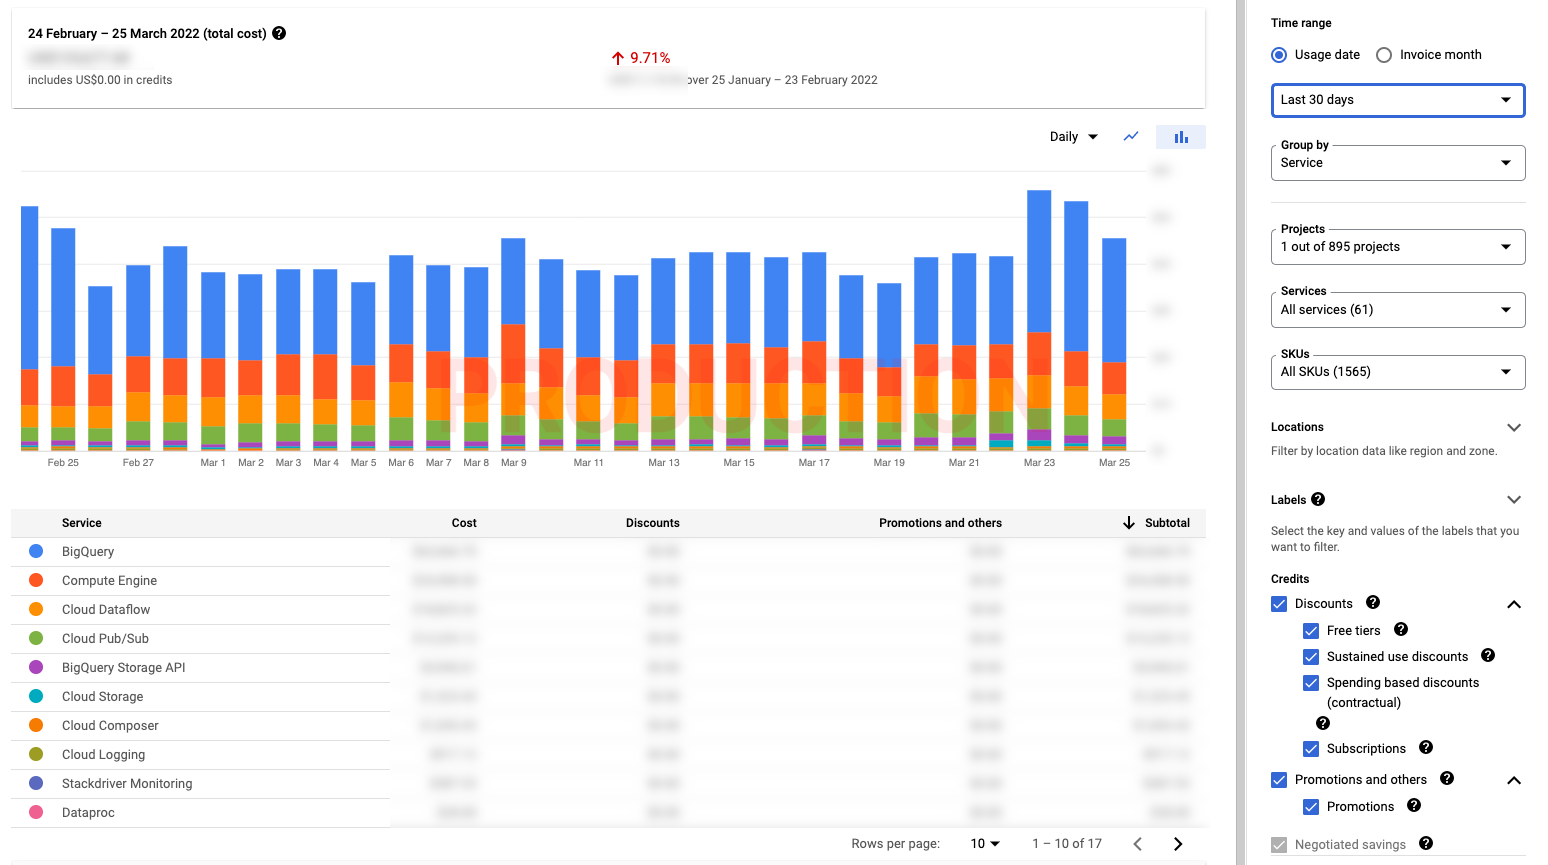
Because Google Cloud Platform billings are oriented around projects, services and SKUs, the built-in cost reports are focused on projects, services and SKUs as well. Below you can find the real example of the report for my primary project, the costs for the last 30 days grouped by the cloud service. As you can see “BigQuery” is a dominant factor in the billing.
Unfortunately, I must not enclose any financial details from the production environments because my employer is a listed company. If I had shown the real numbers I would have had severe troubles.
The presented built-in Cloud Billing Report page provides:
- Spending timeline within daily or monthly data granularity
- Change since the earlier billing period
- Ability to filter or split the total costs by projects, services or SKUs
- Insight into discounts, promotions and negotiated savings
At first, it looks like cloud billing report plots everything you need, doesn’t it? Unfortunately it has many shortcomings. Imagine a project with a dozen different data pipelines using the same type of cloud resources.
- How do you know the cost of every single pipeline?
- How to compare the costs of different data pipelines?
- Does the cost of all resources utilized by the pipeline fit to its business case budget?
- My billing report shows that most of the monthly budget is utilized by BigQuery, which data pipeline should be optimized first?
- Which resource causes the highest cost for the given data pipeline?
As a data engineer I’m interested in the total costs of the selected data pipeline. Then I need to have an ability to drill down into the cost of every single resource used by this pipeline.
Resource oriented costs reports aren’t enough, they don’t offer necessary insight into the data pipelines.
Data pipeline oriented costs tracking
Now we’ve already known the gaps in the “resource oriented costs tracking”, the gaps from a data engineer perspective. How to create “data pipeline oriented costs tracking” in Google Cloud Platform? The reports which show exactly how much every datapipeline in the project cost.
The recipe:
- Develop cloud resources labeling convention
- Apply the labels for all resources used by the data pipelines
- Configure the cloud billing data export to BigQuery
- Craft Datastudio report aligned with the developed labeling convention, there is public example available
- Figure out the workarounds for GCP products which don’t offer necessary details in the billing data export
I would say that 2) and 5) are the toughest parts of the journey.
Labeling convention
There is no silver bullet – perfect cloud resources labeling conventions don’t exist. You have to develop your own labeling convention, but I would like to share a few best practices:
- Introduce labeling naming convention at the very beginning
- Prepare and share the documentation, it should be clear for any adopter how to apply and how to interpret the labels
- Add a new labels only when they’re really needed, too many labels don’t help
- Continuously check the billing report for the resources without labels and fill the gaps
- Last but not least, use the prefix for all custom labels to easily recognize them from the built-in ones
Below you can find the labeling convention I have created in my company:
- allegro__sc_id - Every Allegro library, application or data pipeline is registered in the internal service catalog. This is a central repository of metadata like business/technical owners, responsible team, issue tracker etc. The perfect identifier for cloud resources labeling.
- allegro__job_name - Every data pipeline could consist of many jobs, so the service identifier isn’t enough to identify every part of the pipeline. Job names are also more convenient to use than synthetic service identifiers. As you will see later, many dashboards are organized around the jobs names.
- allegro__branch_name - When you develop and test a new feature it’s handy to assign the branch/feature name as a label. You will exactly know the cost of the experimentation phase for this feature/branch. It’s also quite useful during major upgrades, to verify that after change the job is still as cost-effective as before. Deploy the copy of the job aside the current production, and compare the costs using this label.
I also realized very quickly that billing export doesn’t offer any built-in labels for the well-known resources like BigQuery datasets, Pubsub topics or Cloud Storage buckets. To mitigate this limitation the following extra labels are defined for cloud resources used by the data pipelines:
- allegro__topic_name - The name of the Pubsub topic, apply the label to every topic and subscription
- allegro__dataset_name - The name of the BigQuery dataset, apply the label to every dataset
- allegro__bucket_name - The name of the Cloud Storage bucket, apply the label to every bucket
If the data pipelines subscribe or publish to many Pubsub topics, produce many BigQuery datasets or write to many Cloud Storage buckets the billing export will offer detailed costs for every labeled resource.
Overview reports
Before I move to the technical details I will present a few screens with the reports I’m using on a daily basis. In the end, applying the labels for all resources in cloud is a huge effort, so it should pay off somehow.
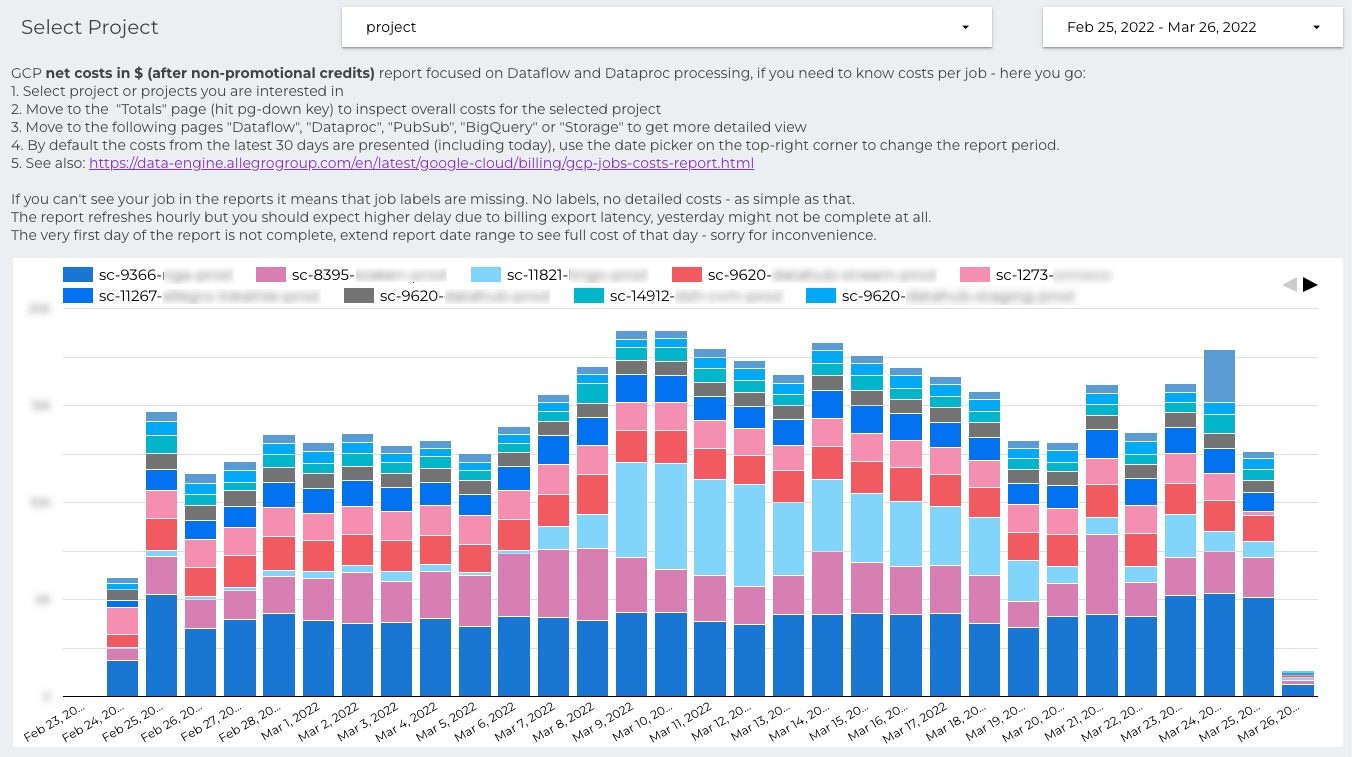
The overview dashboard provides a short manual for newcomers and the total costs of all projects. It also gives full transparency, you can easily compare the costs of every project in the company. I’ve found that it’s also a quite effective method to motivate the teams for doing the optimizations. Nobody wants to be at the top.
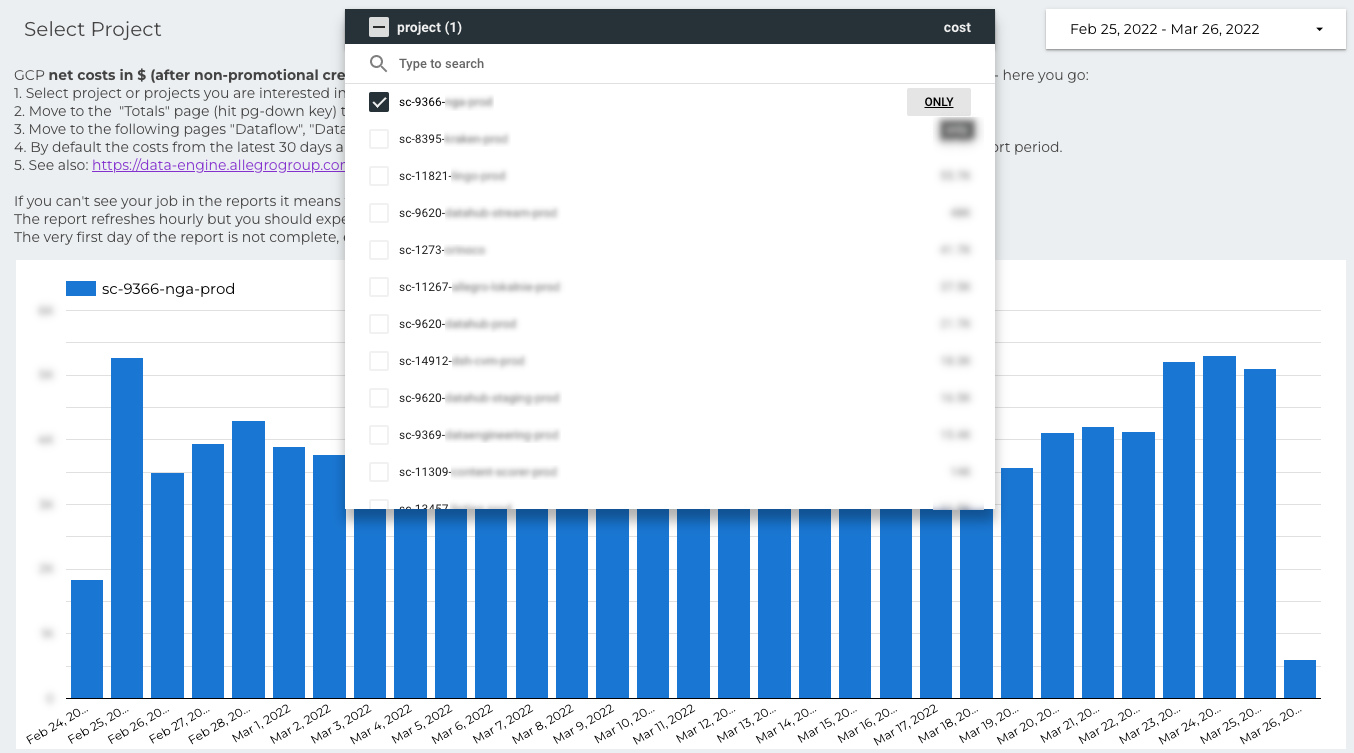
The overview page is the landing page, at the very beginning data engineers should select the project they’ re interested in. You can search for the project by name, and the list is ordered by spending.
When you select the project, there is a second page of the report. The page with the project costs is organized around data pipelines.
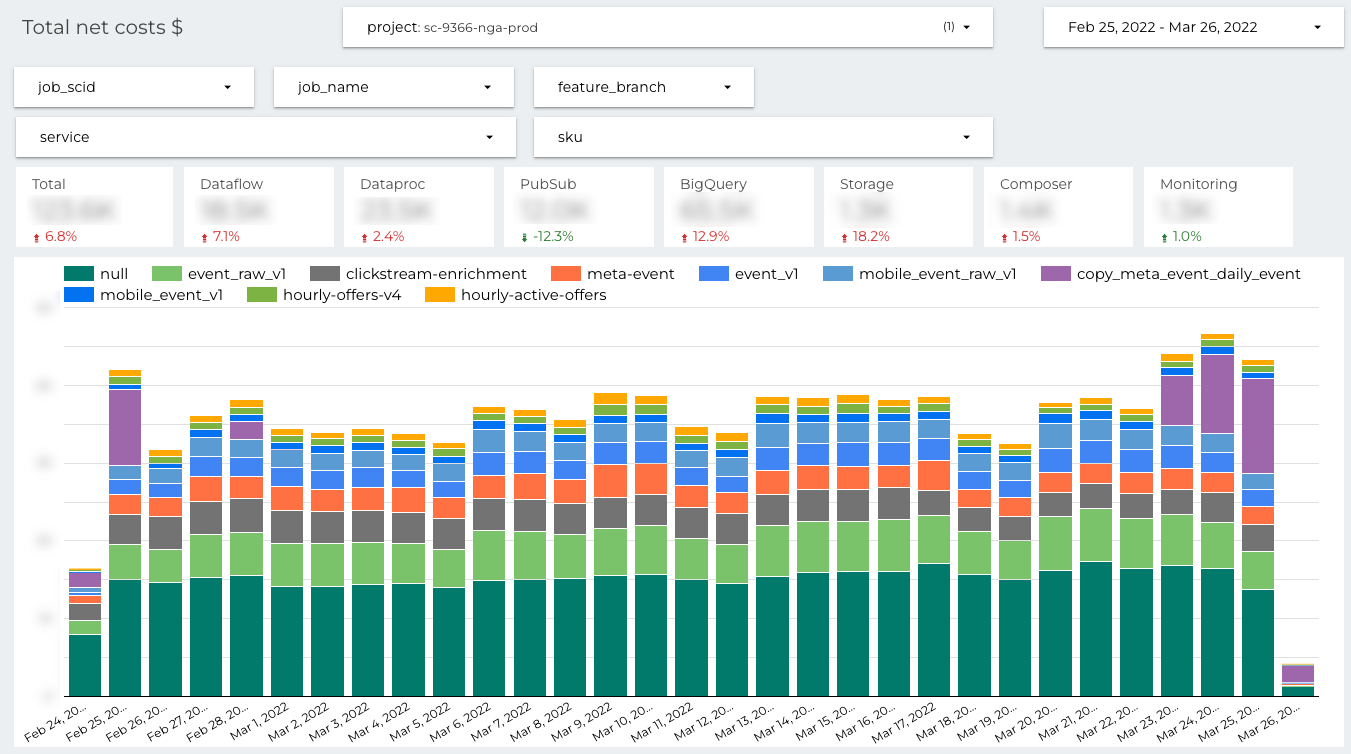
You can see the timeline with daily costs split by job name based on allegro__job_name label. The most expensive named jobs in the project are: “event_raw”, “clickstream-enrichment” and “meta_event”. The presented costs are the total costs of the jobs, all cloud resources used by the jobs are counted. If the pipeline is deployed as Apache Spark job on the Dataproc cluster, it queries BigQuery and saves the computation results into Cloud Storage, the costs of all used cloud resources are presented here.
What does “null” mean here? Due to the historical reasons some labels are missing for the very first data pipelines migrated to GCP. No labels, no detailed reports …
Dataflow and Dataproc reports
In the presented project “sc-9366-nga-prod” there are two types of data pipelines:
- Dataflow / Apache Beam for the real-time jobs
- Dataproc / Apache Spark for the batch jobs
Let start with the next report crafted for Dataflow real-time pipelines:
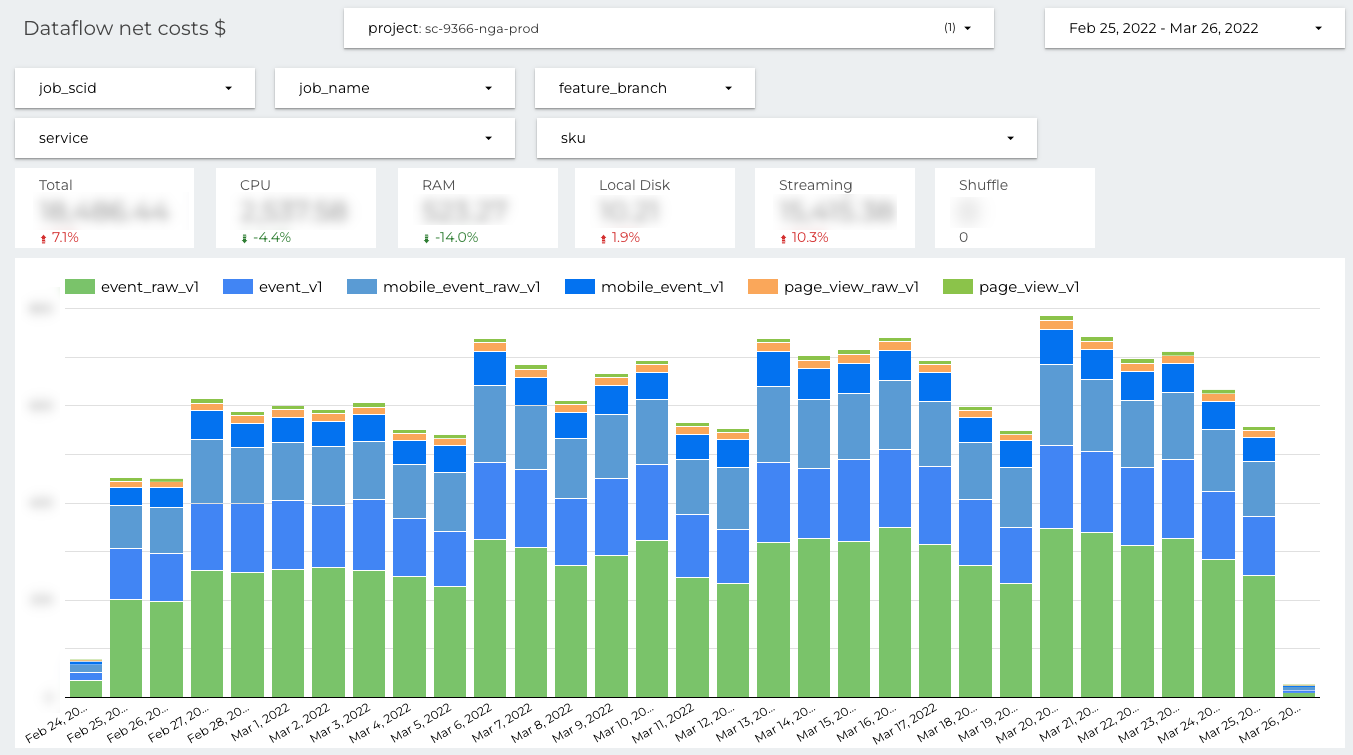
Again, the timeline is organized around the data pipelines. But now, the presented costs come from the Dataflow product only. You can easily spot which job is the most expensive one (“event_raw_v1”) and for which Dataflow SKUs we pay the most.
Very similar dashboard is prepared for the batch jobs deployed on ephemeral Dataproc clusters.
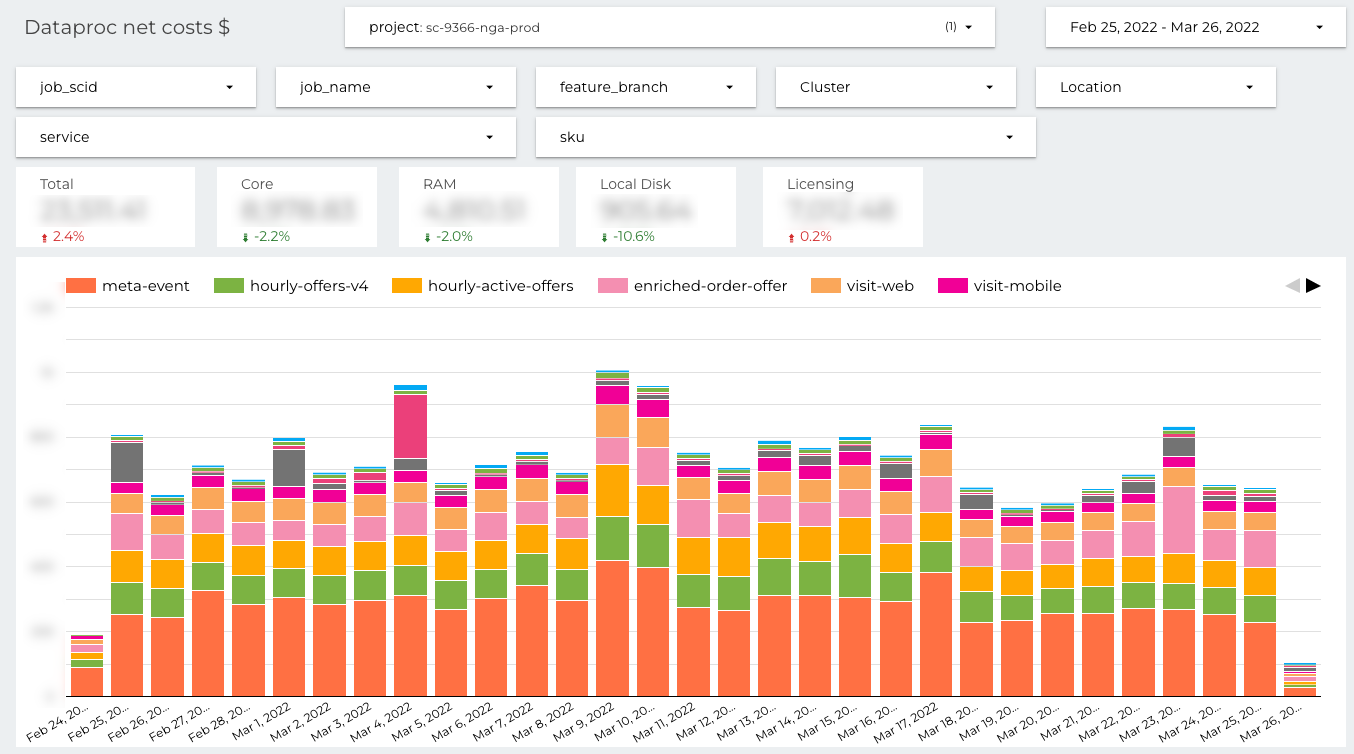
There is a Dataproc specific SKU “Licencing” instead of “Streaming” and “Shuffle” in Dataflow. The definition of the timeline is exactly the same, daily costs organized around jobs.
There is one more important advantage of the presented reports. GCP SKUs are very detailed (which is generally fine), for example every type of CPU is reported under different SKU. But it introduces accidental complexity, on the presented dashboards everything is aggregated under single entry CPU. More convenient to use, when you want to focus on the costs not on the technical details.
BigQuery, Pubsub and Cloud Storage reports
Dataproc or Dataflow are only a part of total data pipeline costs. The next three dashboards are for the cost tracking of the most important “storages” used by the pipelines:
- BigQuery used by batch and streaming pipelines
- Pubsub used by streaming pipelines
- Cloud storage used mainly by batch pipelines as a staging area
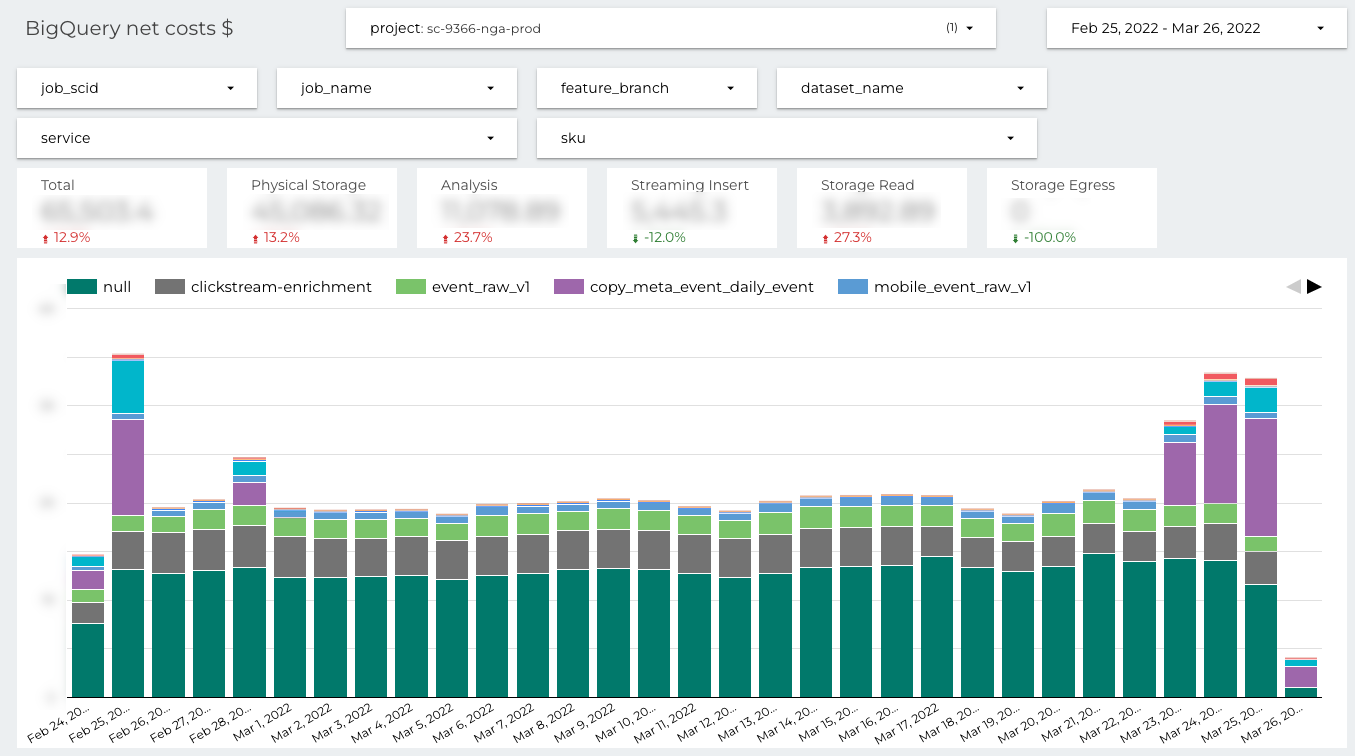
On the BigQuery costs dashboard you can filter by the dataset name. It’s very important when the data pipeline stores results into more than one dataset. The filtering is available only if the allegro__dataset_name label was set.
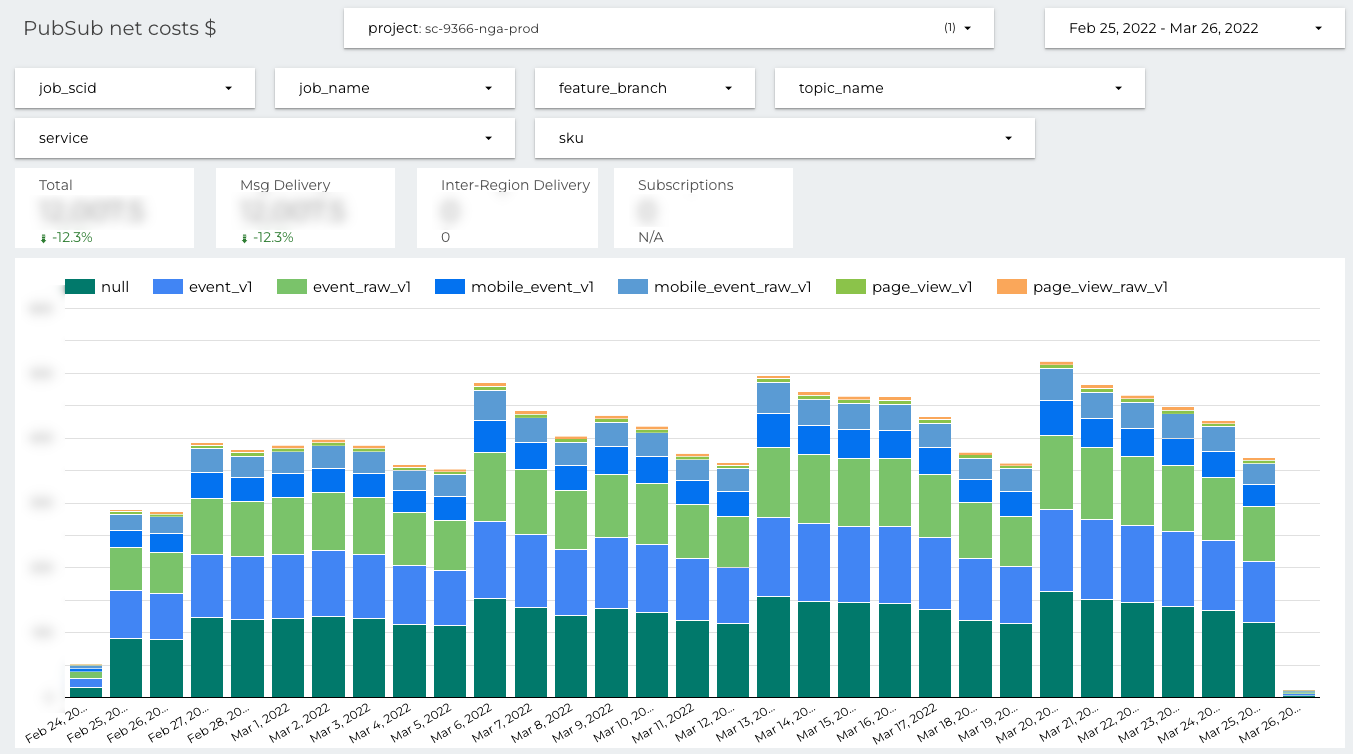
On the Pubsub costs dashboard you can filter by the topic name. It’s very important when the data pipeline publishes to or subscribes on many topics. The filtering is available only if the allegro__topic_name label was set.
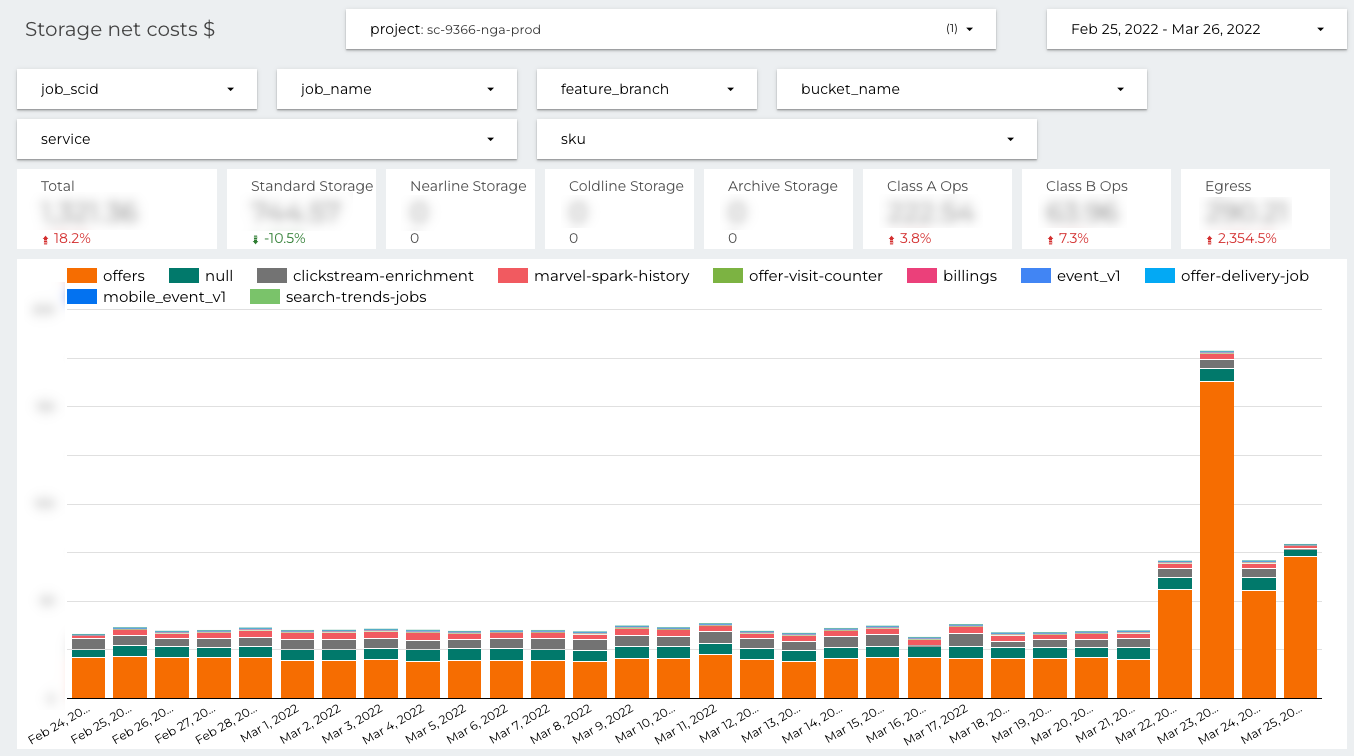
On the Cloud Storage dashboard you can filter by the bucket name. It’s very important when the data pipeline stores results into more than one bucket. The filtering is available only if the allegro__bucket_name label was set.
The challenges
Right now you should have a much better understanding of the difference between “resources” and “data pipelines” oriented cost reports. The final reports may look relatively simple but this is easier said than done.
- How to automate labeling to avoid gaps in the reports?
- What if the GCP product doesn’t support labels at all?
- What if the labels set on the resources for unknown reasons aren’t available in the billing export?
- How to track costs of resources created automatically by managed GCP services? Even if we set labels on the service itself they aren’t propagated to the underlying resources.
- What if you are using the libraries like Apache Beam or Apache Spark, and the API for setting labels isn’t publicly exposed?
- There is also a shared infrastructure like Cloud Composer or Cloud Logging, they also generate significant costs.
Let’s tackle all identified challenges one by one.
Labeling automation
- Use Terraform for “static” cloud resources management like BigQuery datasets, Pubsub topics, Pubsub subscriptions and Cloud storage buckets. Prepare the reusable modules with input parameters required to set the mandatory labels. If Terraform is too low-level, create some DSL on top. We’ve internally developed Gradle plugin for deploying Dataflow real-time jobs and cloud infrastructure together. The plugin is responsible for setting all labels.
- Deliver GitHub actions or composite actions for deploying Dataflow streaming jobs. The action will set all required labels every time when the job is deployed.
- Develop thin wrappers for Dataproc Apache Operators or even better the decorators. They’re responsible for setting all required labels when the batch job is deployed into Cloud Composer.
Looks complex and very time-consuming? It’s for sure, but for dynamic resources like BigQuery queries the situation is even worse. If you don’t set any label on the JobConfiguration the costs of all queries are just aggregated under “BigQuery / Analysis” SKU.
BigQuery jobs
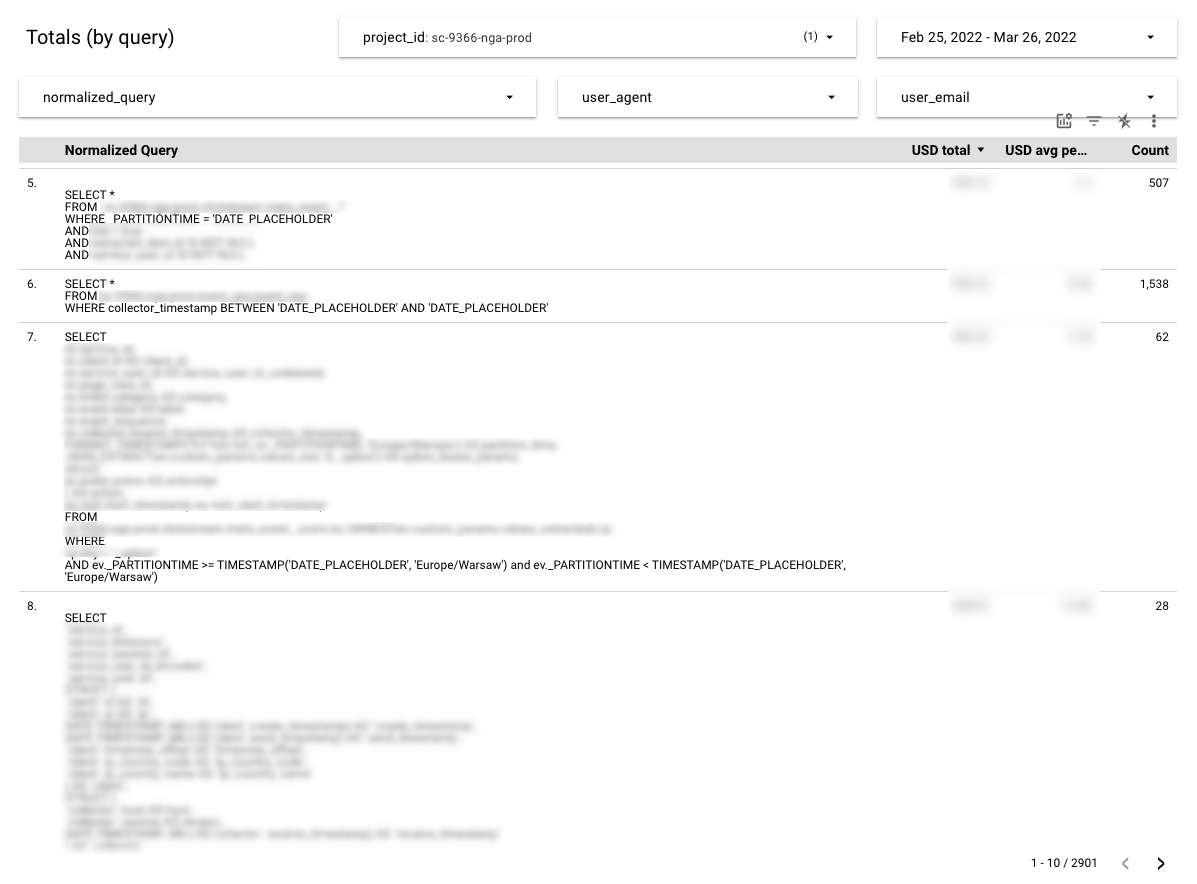
Fortunately all BigQuery jobs are reported in the BigQuery information schema. In the information schema you can find the query expression and “total_bytes_billed” column with billed bytes. As long as cost per TiB is well known, the final cost of the query may be estimated. Instead of labeling every single query it’s easier to prepare the estimated costs report based on queries found in the information schema.
Although, there are at least two disadvantages:
- No direct connection with the data pipelines, you have to manually “assign” the query to the pipeline. Not a big deal for the data engineer who is the author of the queries but annoying if the pipeline executes a dozen of them.
- Daily or hourly jobs don’t generate exactly the same query on every run. The time related expressions are typically varying and need to be normalized
You can use the following regular expression for query normalization, all datetime expressions are replaced by the static placeholder:
1
REGEXP_REPLACE(query, '\\d{8,10}|\\d{4}-\\d{2}-\\d{2}([T\\s]\\d{2}:\\d{2}:\\d{2}(\\.\\d{3})?)?', 'DATE_PLACEHOLDER')
BigQuery Storage API
There is at least one crucial GCP product without support for labels: BigQuery Storage API. All costs are aggregated under “BigQuery Storage API / [Write | Read]” SKUs, very similar situation to the BigQuery Jobs when all costs go to the “Analysis” SKU. There is an open issue in the bug tracker.
Unfortunately, BigQuery Storage API doesn’t expose any details in the BigQuery information schema to estimate the costs like for BigQuery jobs. I don’t understand how the BigQuery Storage API has got GA status if such limitations still exist.
I haven’t found any workaround to estimate the costs for BigQuery Storage API, yet. Be sure to let me know if you know any.
BigQuery 3rd party APIs
The most data pipelines aren’t implemented within the BigQuery API directly but with some 3rd party, higher level API. The high level API should expose the underlying BigQuery API for setting the labels. But in reality it isn’t always true.
- Apache Beam still doesn’t support job labels on BigQuery read/write transforms BEAM-9967
- BigQuery Spark Connector has recently got the support for setting job labels PR-586
- Spotify Scio has support for the labels for the long time, but only if the Scio specific BigQuery connector is used PR-3375
BigQuery tables
Do you know why BigQuery report for storage costs is organized around datasets, not tables? Because the labels on the BigQuery tables aren’t available in the billing export, only labels from datasets are exported. Due to this limitation, I have many fine-grained datasets in the project, just to get proper accountability.
Please vote for the following issue if you need costs tracking on the table level.
Dataflow internal subscriptions
When you make a Pubsub subscription for a Dataflow job and configure timestamp attribute for watermark tracking, extra tracking subscription is created. See the official documentation or stack overflow question for more details. Unfortunately the tracking subscriptions don’t get labels from Dataflow jobs nor original subscriptions.
Please vote for the following issue if you need 100% labels coverage on the Pubsub subscriptions.
The internal subscriptions cost exactly like the original subscriptions, so you can estimate the total costs for both subscriptions.
Shared infrastructure
The costs of shared infrastructure can not be assigned to any particular data pipeline. Just stay with the “resource oriented” billing and try to minimize the overall costs. From my experience there are two of the most expensive shared infrastructure costs on Google Cloud Platform for data pipelines.
- Cloud Composer – if you want to optimize Cloud Composer I highly recommend reading one of my blog posts - GCP Cloud Composer 1.x tuning
- Cloud Logging – to minimize the costs, minimize the number of log entries produced by the data pipelines and their infrastructure
Below you find the number of log entries from my production environment for the one day.
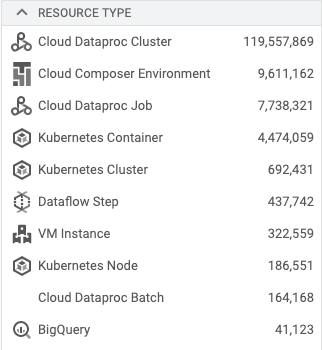
As you can see, a lot of logs come from the Dataproc ephemeral clusters. The logging from the cluster may be enabled or disabled, nothing between. The best thing you can do is to apply exclusion filters on the log router. Filtered logs aren’t counted in the billings.
If you have any other practices for shared infrastructure cost optimizations, let me know in the comments.
Summary
I fully realize that FinOps discipline isn’t easy to adopt for data engineers. Finally, we would like to develop data pipelines, not to think about billings, budgets and overspending.
But in the public cloud era there is no choice, you have to check costs of the data pipelines in exactly the same way as you check overall health, latency or throughput. The built-in cloud billing tools organized around cloud services and SKUs don’t help a lot. To get detailed costs reports you have put a lot of effort to create data pipeline oriented costs monitoring.
I hope that this blog post gives you some ideas on how to develop your own toolset for applying FinOps discipline. Remember, the sooner the discipline is adopted the more savings could be expected.
Comments