
If you are a BigData engineer who develops batch data pipelines, you might often hear that stream processing is the future. It unlocks the full potential of data that’s often unbounded in nature. You don’t need batch pipelines anymore, implement everything in a streaming fashion. There are plenty of modern and easy to use tools for stream processing. Give it a try with Apache Beam 😀
In this blog post you will learn:
- How to implement streaming data pipeline with Apache Beam SQL and deploy it on the Google Cloud Platform using Dataflow runner.
- The importance of the watermark to calculate the correct results within the minimal latency.
- What’s the impact of late data for the streaming pipelines?
- A few undocumented Dataflow features 😉
Streaming pipeline overview
Diagram below presents the streaming data pipeline for IoT like system:
flowchart LR
Sensor1 --> A1[Unreliable Network] --> A2[/Pubsub topic 1/] --> A3[Tumble Window]
Sensor2 --> B1[Unreliable Network] --> B2[/Pubsub topic 2/] --> B3[Tumble Window]
subgraph Dataflow SQL
A3[Tumble Window] --> C1(Left Outer Join)
B3[Tumble Window] --> C1(Left Outer Join)
end
C1(Left Outer Join) --> C2[(BigQuery Table)]
There are two sensors that send their readings periodically over unreliable network to Pubsub topics.
The payload looks like ts with a sensor event timestamp and val with sensor reading:
1
2
3
{'ts': '2022-08-07T10:28:28+00:00', 'val': 0.69}
{'ts': '2022-08-07T10:28:29+00:00', 'val': 0.67}
{'ts': '2022-08-07T10:28:30+00:00', 'val': 0.89}
Next, there is a Dataflow SQL job which subscribes to the topics and calculate the averages of the sensor readings in short non-overlapping fixed windows (tumble windows). The averages from both sensors are joined and the job calculates the difference between them. The readings from the right stream are optional, so if there is no data from second sensor the calculation is done within data from the first sensor only. Finally, the results of the computation are written continuously to BigQuery table for further analysis.
The query:
1
2
3
4
5
6
7
8
9
10
11
12
13
14
15
16
17
18
19
20
21
SELECT
    CURRENT_TIMESTAMP, s1.window_start, s1.window_end,
    s1.samples + COALESCE(s2.samples, 0),
    s1.value_avg - COALESCE(s2.value_avg, 0.0)
FROM (
    SELECT
        TUMBLE_START(event_timestamp, INTERVAL '5' SECOND) AS window_start,
        TUMBLE_END(event_timestamp, INTERVAL '5' SECOND) AS window_end,
        AVG(stream1.payload.val) AS value_avg,
        COUNT(*) AS samples
    FROM stream1
    GROUP BY TUMBLE(event_timestamp, INTERVAL '5' SECOND)) s1
LEFT OUTER JOIN (
    SELECT
        TUMBLE_START(event_timestamp, INTERVAL '5' SECOND) AS window_start,
        TUMBLE_END(event_timestamp, INTERVAL '5' SECOND) AS window_end,
        AVG(stream2.payload.val) AS value_avg,
        COUNT(*) AS samples
    FROM stream2
    GROUP BY TUMBLE(event_timestamp, INTERVAL '5' SECOND)) s2
ON s1.window_start = s2.window_start AND s1.window_end = s2.window_end
Pubsub topics
Create Pubsub topics for streams of sensor data:
1
2
3
4
$ gcloud pubsub topics create marcin-atm22-stream-1
Created topic [projects/sc-9366-nga-dev/topics/marcin-atm22-stream-1].
$ gcloud pubsub topics create marcin-atm22-stream-2
Created topic [projects/sc-9366-nga-dev/topics/marcin-atm22-stream-2].
SQL shell
Starting with version 2.6.0 Beam SQL includes an interactive shell, called the Beam SQL shell. The shell supports writing the pipelines as SQL queries and execute the queries on Direct runner. You can also specify different runner, for example Dataflow and execute the pipeline on Google Cloud Platform.
The latest working version of Apache Beam SQL shell is 2.38. See https://github.com/apache/beam/issues/22615 for more details.
To use Beam SQL shell you must build the binary from sources. Clone Apache Beam repository and execute the following command to build the SQL shell with support for Google IO connectors and Dataflow runner.
1
2
3
4
5
6
$ ./gradlew -p sdks/java/extensions/sql/shell \
    -Pbeam.sql.shell.bundled=':sdks:java:io:google-cloud-platform,:runners:google-cloud-dataflow-java' \
    installDist
(...)
BUILD SUCCESSFUL in 22s
88 actionable tasks: 43 executed, 35 from cache, 10 up-to-date
Run Apache Beam SQL shell and check for registered tables:
1
2
3
4
5
6
7
8
9
10
11
$ ./sdks/java/extensions/sql/shell/build/install/shell/bin/shell
Welcome to Beam SQL 2.38.0-SNAPSHOT (based on sqlline version 1.4.0)
0: BeamSQL> !tables
+-----------+-------------+------------+--------------+---------+----------+------------+
| TABLE_CAT | TABLE_SCHEM | TABLE_NAME | TABLE_TYPE   | REMARKS | TYPE_CAT | TYPE_SCHEM |
+-----------+-------------+------------+--------------+---------+----------+------------+
|           | metadata    | COLUMNS    | SYSTEM TABLE |         |          |            |
|           | metadata    | TABLES     | SYSTEM TABLE |         |          |            |
+-----------+-------------+------------+-----------  -+---------+----------+------------+
0: BeamSQL> !quit
Closing: org.apache.beam.sdk.extensions.sql.impl.JdbcConnection
External tables
With Beam SQL extension you can map Pubsub topics and BigQuery tables as external tables. It’s required to use any external storage system in SQL queries.
Create external tables for Pubsub topics:
1
2
3
4
5
6
7
8
9
10
11
12
13
14
0: BeamSQL> CREATE EXTERNAL TABLE stream1 (
. . . . . >   event_timestamp TIMESTAMP, attributes MAP<VARCHAR, VARCHAR>,
. . . . . >   payload ROW<ts TIMESTAMP, val DOUBLE>)
. . . . . > TYPE pubsub
. . . . . > LOCATION 'projects/sc-9366-nga-dev/topics/marcin-atm22-stream-1'
. . . . . > TBLPROPERTIES '{"format": "json", "timestampAttributeKey":"ts"}';
No rows affected (0.819 seconds)
0: BeamSQL> CREATE EXTERNAL TABLE stream2 (
. . . . . >   event_timestamp TIMESTAMP, attributes MAP<VARCHAR, VARCHAR>,
. . . . . >   payload ROW<ts TIMESTAMP, val DOUBLE>)
. . . . . > TYPE pubsub
. . . . . > LOCATION 'projects/sc-9366-nga-dev/topics/marcin-atm22-stream-2'
. . . . . > TBLPROPERTIES '{"format": "json", "timestampAttributeKey":"ts"}';
No rows affected (0.019 seconds)
Pay special attention for timestampAttributeKey property, the Pubsub attribute used for tracking event time.
Create external BigQuery table for the results:
1
2
3
4
5
6
7
0: BeamSQL> CREATE EXTERNAL TABLE results (
. . . . . >   created_at TIMESTAMP, window_start TIMESTAMP, window_end TIMESTAMP,
. . . . . >   samples INT, avg_diff DOUBLE)
. . . . . > TYPE bigquery
. . . . . > LOCATION 'sc-9366-nga-dev:marcin_atm22.results'
. . . . . > TBLPROPERTIES '{"writeDisposition": "WRITE_APPEND"}';
No rows affected (0.013 seconds)
WRITE_APPEND disposition for the BigQuery writer, the pipeline deploys and runs even if the table already exists.
Check the table schema:
1
2
3
4
5
6
7
8
9
10
0: BeamSQL> !describe results
+-----------+-------------+------------+--------------+-----------+--------------+
| TABLE_CAT | TABLE_SCHEM | TABLE_NAME | COLUMN_NAME  | DATA_TYPE | TYPE_NAME    |
+-----------+-------------+------------+--------------+-----------+--------------+
|           | beam        | results    | created_at   | 93        | TIMESTAMP(6) |
|           | beam        | results    | window_start | 93        | TIMESTAMP(6) |
|           | beam        | results    | window_end   | 93        | TIMESTAMP(6) |
|           | beam        | results    | samples      | 4         | INTEGER      |
|           | beam        | results    | avg_diff     | 8         | DOUBLE       |
+-----------+-------------+------------+--------------+-----------+--------------+
Try to query the table. You will get an error because table doesn’t exist yet, the job will create the table just before the first insert.
1
2
3
0: BeamSQL> SELECT COUNT(*) from RESULTS;
Error: Error while executing SQL "SELECT COUNT(*) from RESULTS": com.google.api.gax.rpc.NotFoundException: io.grpc.StatusRuntimeException: NOT_FOUND:
Not found: Table sc-9366-nga-dev:marcin_atm22.results (state=,code=0)
SQL pipeline on Direct runner
In theory, you should be able to run SQL pipeline on Direct runner. But in practice the following windowed query on the single stream takes ~15 minutes to finish. I don’t know why Direct runner is so slow for tiny amount of data, I would expect decent performance on Macbook M1 Pro.
1
2
3
4
5
6
7
8
SELECT
    TUMBLE_START(event_timestamp, INTERVAL '5' SECOND) AS window_start,
    TUMBLE_END(event_timestamp, INTERVAL '5' SECOND) AS window_end,
    AVG(stream1.payload.val) AS value_avg,
    COUNT(*) AS samples
FROM stream1
GROUP BY TUMBLE(event_timestamp, INTERVAL '5' SECOND)) s1
LIMIT 5;
Pay special attention for the LIMIT clause. Direct runner collects results in the global window, and you have to specify non-default trigger to get any result.
The LIMIT clause is translated into data-driven trigger, to emit the results after 5 elements.
SQL pipeline on Dataflow runner
Change default Direct runner to Dataflow runner and set a few mandatory pipeline options:
1
2
3
4
5
6
0: BeamSQL> SET runner = DataflowRunner;
No rows affected (0.017 seconds)
0: BeamSQL> set region = 'europe-west1';
No rows affected (0.004 seconds)
0: BeamSQL> set gcpTempLocation = 'gs://sc-9366-nga-dev-marcin/tmp';
No rows affected (0.015 seconds)
Execute final query and wait a few minutes until Dataflow job creates subscriptions and connects to Pubsub topics:
1
2
3
4
5
6
7
8
9
10
11
12
13
14
15
16
17
18
19
20
21
22
23
24
25
26
27
28
29
0: BeamSQL> INSERT INTO results
. . . . . > SELECT
. . . . . >     CURRENT_TIMESTAMP, s1.window_start, s1.window_end,
. . . . . >     s1.samples + COALESCE(s2.samples, 0),
. . . . . >     s1.value_avg - COALESCE(s2.value_avg, 0.0)
. . . . . > FROM (
. . . . . >     SELECT
. . . . . >         TUMBLE_START(event_timestamp, INTERVAL '5' SECOND) AS window_start,
. . . . . >         TUMBLE_END(event_timestamp, INTERVAL '5' SECOND) AS window_end,
. . . . . >         AVG(stream1.payload.val) AS value_avg,
. . . . . >         COUNT(*) AS samples
. . . . . >     FROM stream1
. . . . . >     GROUP BY TUMBLE(event_timestamp, INTERVAL '5' SECOND)) s1
. . . . . > LEFT OUTER JOIN (
. . . . . >     SELECT
. . . . . >         TUMBLE_START(event_timestamp, INTERVAL '5' SECOND) AS window_start,
. . . . . >         TUMBLE_END(event_timestamp, INTERVAL '5' SECOND) AS window_end,
. . . . . >         AVG(stream2.payload.val) AS value_avg,
. . . . . >         COUNT(*) AS samples
. . . . . >     FROM stream2
. . . . . >     GROUP BY TUMBLE(event_timestamp, INTERVAL '5' SECOND)) s2
. . . . . > ON s1.window_start = s2.window_start AND s1.window_end = s2.window_end;
(...)
Executing pipeline on the Dataflow Service, which will have billing implications related to Google Compute Engine usage and other Google Cloud Services.
To access the Dataflow monitoring console, please navigate to https://console.cloud.google.com/dataflow/jobs/europe-west1/2022-08-08_11_52_01-1894085106596231231?project=sc-9366-nga-dev
(...)
INFO: To cancel the job using the 'gcloud' tool, run:
> gcloud dataflow jobs --project=sc-9366-nga-dev cancel --region=europe-west1 2022-08-07_04_04_14-1079245398928473428
No rows affected (26.455 seconds)
Command line deployment
Beam SQL shell is convenient for experimentation.
But for production deployment I would prefer
gcloud Dataflow SQL query command or
DataflowStartSqlJobOperator Apache Airflow operator.
1
2
3
4
5
6
7
8
9
10
11
12
13
14
15
16
17
18
19
20
21
22
23
24
25
26
27
28
29
30
31
32
33
34
35
36
37
38
39
40
41
42
43
44
45
46
47
48
49
50
51
52
53
$ gcloud dataflow sql query \
  --job-name=marcin-atm22-gcloud \
  --region=europe-west1 \
  --bigquery-project=sc-9366-nga-dev \
  --bigquery-dataset=marcin_atm22 \
  --bigquery-table=gcloud-results \
  --bigquery-write-disposition=write-append \
"
CREATE EXTERNAL TABLE stream1 (
    event_timestamp TIMESTAMP, attributes MAP<VARCHAR, VARCHAR>,
    payload ROW<ts TIMESTAMP, val DOUBLE>)
TYPE pubsub
LOCATION 'projects/sc-9366-nga-dev/topics/marcin-atm22-stream-1'
TBLPROPERTIES  '{\"format\": \"json\", \"timestampAttributeKey\":\"ts\"}';

CREATE EXTERNAL TABLE stream2 (
    event_timestamp TIMESTAMP, attributes MAP<VARCHAR, VARCHAR>,
    payload ROW<ts TIMESTAMP, val DOUBLE>)
TYPE pubsub
LOCATION 'projects/sc-9366-nga-dev/topics/marcin-atm22-stream-2'
TBLPROPERTIES  '{\"format\": \"json\", \"timestampAttributeKey\":\"ts\"}';

SELECT
    CURRENT_TIMESTAMP, s1.window_start, s1.window_end,
    s1.samples + COALESCE(s2.samples, 0),
    s1.value_avg - COALESCE(s2.value_avg, 0.0)
FROM (
    SELECT
        TUMBLE_START(event_timestamp, INTERVAL '5' SECOND) AS window_start,
        TUMBLE_END(event_timestamp, INTERVAL '5' SECOND) AS window_end,
        AVG(stream1.payload.val) AS value_avg,
        COUNT(*) AS samples
    FROM stream1
    GROUP BY TUMBLE(event_timestamp, INTERVAL '5' SECOND)) s1
LEFT OUTER JOIN (
    SELECT
        TUMBLE_START(event_timestamp, INTERVAL '5' SECOND) AS window_start,
        TUMBLE_END(event_timestamp, INTERVAL '5' SECOND) AS window_end,
        AVG(stream2.payload.val) AS value_avg,
        COUNT(*) AS samples
    FROM stream2
    GROUP BY TUMBLE(event_timestamp, INTERVAL '5' SECOND)) s2
ON s1.window_start = s2.window_start AND s1.window_end = s2.window_end;
"

job:
  createTime: '2022-08-12T10:11:24.261616Z'
  currentStateTime: '1970-01-01T00:00:00Z'
  id: 2022-08-12_03_11_23-11958657005279157033
  location: europe-west1
  name: marcin-atm22-gcloud
  projectId: sc-9366-nga-dev
  startTime: '2022-08-12T10:11:24.261616Z'
Unfortunately I couldn’t manage deployment using gcloud command.
After a few minutes I’ve got the following Dataflow job error on StackDriver console:
1
2
3
4
5
6
7
8
9
10
11
12
13
14
15
16
17
18
19
20
com.google.cloud.dataflow.sqllauncher.BadTemplateArgumentsException: Error in SQL query: Syntax error: Expected ")" or "," but got "<" [at 2:73]
	at com.google.cloud.dataflow.sqllauncher.DataflowSqlLauncher.buildPipeline(DataflowSqlLauncher.java:136)
	at com.google.cloud.dataflow.sqllauncher.DataflowSqlLauncher.buildAndRunPipeline(DataflowSqlLauncher.java:108)
	at com.google.cloud.dataflow.sqllauncher.DataflowSqlLauncher.main(DataflowSqlLauncher.java:74)
Caused by: com.google.zetasql.SqlException: Syntax error: Expected ")" or "," but got "<" [at 2:73]
	at com.google.zetasql.Analyzer.extractTableNamesFromNextStatement(Analyzer.java:251)
	at org.apache.beam.sdk.extensions.sql.zetasql.SqlAnalyzer.extractTableNames(SqlAnalyzer.java:64)
	at org.apache.beam.sdk.extensions.sql.zetasql.ZetaSQLPlannerImpl.rel(ZetaSQLPlannerImpl.java:87)
	at org.apache.beam.sdk.extensions.sql.zetasql.ZetaSQLQueryPlanner.convertToBeamRelInternal(ZetaSQLQueryPlanner.java:198)
	at org.apache.beam.sdk.extensions.sql.zetasql.ZetaSQLQueryPlanner.convertToBeamRel(ZetaSQLQueryPlanner.java:186)
	at org.apache.beam.sdk.extensions.sql.impl.BeamSqlEnv.parseQuery(BeamSqlEnv.java:112)
	at org.apache.beam.sdk.extensions.sql.SqlTransform.expand(SqlTransform.java:171)
	at org.apache.beam.sdk.extensions.sql.SqlTransform.expand(SqlTransform.java:110)
	at org.apache.beam.sdk.Pipeline.applyInternal(Pipeline.java:548)
	at org.apache.beam.sdk.Pipeline.applyTransform(Pipeline.java:499)
	at org.apache.beam.sdk.values.PBegin.apply(PBegin.java:56)
	at org.apache.beam.sdk.Pipeline.apply(Pipeline.java:192)
	at com.google.cloud.dataflow.sqllauncher.DataflowSqlLauncher.buildPipelineOrThrow(DataflowSqlLauncher.java:194)
	at com.google.cloud.dataflow.sqllauncher.DataflowSqlLauncher.buildPipeline(DataflowSqlLauncher.java:124)
	... 2 more
It looks that the query parser isn’t able to parse external table definition for the Pubsub topic. Checkmate!
If you know how to run the query with external table definitions using gcloud dataflow sql query, please let me know.
Data generator
Back to the job deployed on Dataflow runner from SQL shell and generate some traffic from the sensors. I prepared synthetic data generator implemented as Python script:
- The generator publishes the event every second.
- You can specify the destination Pubsub topic.
- You can also define a delay of generated events for simulating late data.
- As a homework you can introduce some variability in the event time, generate non-monotonic readings and make a computation even more tricky.
1
2
3
4
5
6
7
8
9
10
11
12
13
14
15
16
17
18
19
20
21
22
23
24
25
26
27
28
29
30
31
32
33
34
35
import argparse
import json
from datetime import datetime, timezone, timedelta
from random import random
from time import sleep

from google.cloud import pubsub_v1


def generate_event(delay):
    ts = datetime.now(tz=timezone.utc) - timedelta(seconds=delay)
    return {
        'ts': ts.isoformat(timespec='seconds'),
        'val': round(random(), 2)
    }


def publish_event(publisher, topic, event):
    data = json.dumps(event).encode('utf-8')
    publisher.publish(topic, data=data, ts=event['ts'])


if __name__ == '__main__':
    parser = argparse.ArgumentParser()
    parser.add_argument('--topic', required=True)
    parser.add_argument("--delay", default=0, type=int)
    args = parser.parse_args()

    publisher = pubsub_v1.PublisherClient()

    while True:
        event = generate_event(args.delay)
        print(event)
        publish_event(publisher, args.topic, event)
        sleep(1)
Do you remember timestampAttributeKey property for Pubsub external table definition?
Generator sets ts attribute for each published message based on event time (line 20).
Using this attribute Dataflow runner is able to track data freshness in the stream!
Start data generators for topics stream-1 and stream-2:
1
2
3
4
5
$ python generator.py --topic projects/sc-9366-nga-dev/topics/marcin-atm22-stream-1
{'ts': '2022-08-07T10:28:28+00:00', 'val': 0.69}
{'ts': '2022-08-07T10:28:29+00:00', 'val': 0.67}
{'ts': '2022-08-07T10:28:30+00:00', 'val': 0.89}
(...)
1
2
3
4
5
$ python generator.py --topic projects/sc-9366-nga-dev/topics/marcin-atm22-stream-2
{'ts': '2022-08-07T10:28:35+00:00', 'val': 0.53}
{'ts': '2022-08-07T10:28:36+00:00', 'val': 0.76}
{'ts': '2022-08-07T10:28:37+00:00', 'val': 0.94}
(...)
Configure Beam SQL to use Direct runner again:
1
2
0: BeamSQL> SET runner = DirectRunner;
No rows affected (0.017 seconds)
Try to execute SQL query on Pubsub topics, you should get a decoded sensor payload printed on the console.
1
2
3
4
5
6
7
8
9
10
11
12
13
14
15
16
17
18
19
20
21
22
0: BeamSQL> SELECT current_timestamp, event_timestamp, stream1.payload.ts, stream1.payload.val FROM stream1 LIMIT 5;
+---------------------+---------------------+---------------------+------+
| current_timestamp   | event_timestamp     |   ts                | val  |
+---------------------+---------------------+---------------------+------+
| 2022-08-07 10:39:13 | 2022-08-07 10:39:07 | 2022-08-07 10:39:07 | 0.14 |
| 2022-08-07 10:39:13 | 2022-08-07 10:39:05 | 2022-08-07 10:39:05 | 0.2  |
| 2022-08-07 10:39:13 | 2022-08-07 10:39:09 | 2022-08-07 10:39:09 | 0.05 |
| 2022-08-07 10:39:13 | 2022-08-07 10:39:08 | 2022-08-07 10:39:08 | 0.95 |
| 2022-08-07 10:39:13 | 2022-08-07 10:39:01 | 2022-08-07 10:39:01 | 0.63 |
+---------------------+---------------------+---------------------+------+
5 rows selected (26.292 seconds)
0: BeamSQL> SELECT current_timestamp, event_timestamp, stream2.payload.ts, stream2.payload.val FROM stream2 LIMIT 5;
+---------------------+---------------------+---------------------+------+
| current_timestamp   | event_timestamp     |   ts                | val  |
+---------------------+---------------------+---------------------+------+
| 2022-08-07 10:42:52 | 2022-08-07 10:42:49 | 2022-08-07 10:42:49 | 0.99 |
| 2022-08-07 10:42:52 | 2022-08-07 10:42:50 | 2022-08-07 10:42:50 | 0.36 |
| 2022-08-07 10:42:52 | 2022-08-07 10:42:47 | 2022-08-07 10:42:47 | 0.78 |
| 2022-08-07 10:42:52 | 2022-08-07 10:42:48 | 2022-08-07 10:42:48 | 0.52 |
| 2022-08-07 10:42:52 | 2022-08-07 10:42:40 | 2022-08-07 10:42:40 | 0.72 |
+---------------------+---------------------+---------------------+------+
5 rows selected (16.239 seconds)
Dataflow job
Now, it’s time to examine logical graph of the Dataflow job. It should look like the graph presented below:
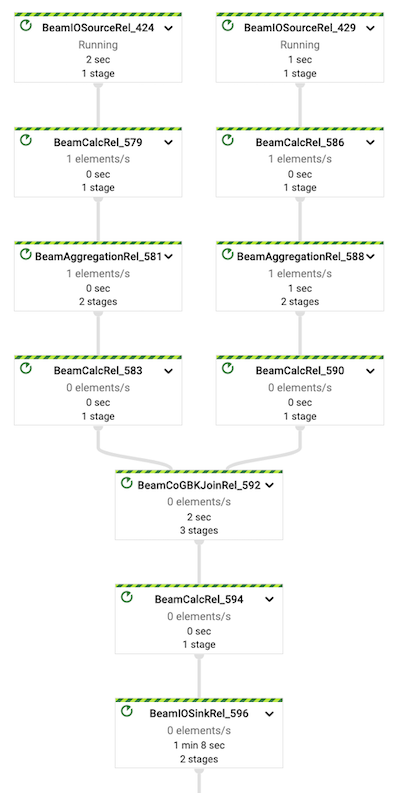
- IO source for Pubsub subscriptions (steps: 424, 429)
- Calculation for decoding payload (steps: 579, 586)
- Aggregation for windowing (steps: 581, 588)
- Calculation for averages (steps: 583, 590)
- Co GBK (Group By Key) for joining streams (step 592)
- Calculation final results (step 594)
- IO sink for saving results to BigQuery table (step 594)
Dataflow optimizes the logical graph into physical execution graph. As you can see some steps are fused together but the overall shape of the graph stays unchanged.
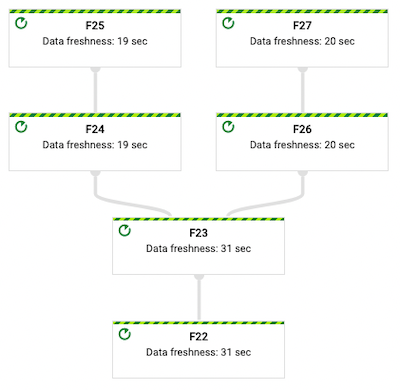
Examine execution graph for data freshness:
- There is a 19–20 seconds of delay for initial steps responsible for reading and decoding data from Pubsub topics.
- Windowing, and saving to BigQuery introduces another 11 or 12 seconds of latency.
- Total latency of the pipeline reported by Dataflow runner is about 31 seconds.
Finally, examine the results generated by the job by querying BigQuery table:
1
2
3
4
5
6
7
8
9
10
11
12
13
14
15
0: BeamSQL> SELECT
. . . . . >   window_start,
. . . . . >   window_end,
. . . . . >   created_at,
. . . . . >   TIMESTAMPDIFF(SECOND, created_at, window_end) AS delay_secs,
. . . . . >   samples AS no_of_samples,
. . . . . >   ROUND(avg_diff, 2) AS avg_diff
. . . . . > FROM results
. . . . . > ORDER BY window_end DESC
. . . . . > LIMIT 1;
+---------------------+---------------------+---------------------+------------+---------------+----------+
| window_start        | window_end          | created_at          | delay_secs | no_of_samples | avg_diff |
+---------------------+---------------------+---------------------+------------+---------------+----------+
| 2022-08-08 19:07:10 | 2022-08-08 19:07:15 | 2022-08-08 19:07:43 | -28        | 10            | 0.34     |
+---------------------+---------------------+---------------------+------------+---------------+----------+
- The results are calculated based on the sensor readings emitted between
19:07:10(inclusive) and19:07:15(exclusive). INSERT INTO results SELECT ...statement was calculated at19:07:43, 28 seconds after end of the window.- Because Dataflow data freshness for the latest step
F22is 31 seconds, it means that the last step takes around31 - 28 = 3seconds.
Late data
Simulate late data from a phantom sensor.
Start second generator for stream-2 topic but with configured delay of 60 seconds:
1
$ python generator.py --topic projects/sc-9366-nga-dev/topics/marcin-atm22-stream-2 --delay 60
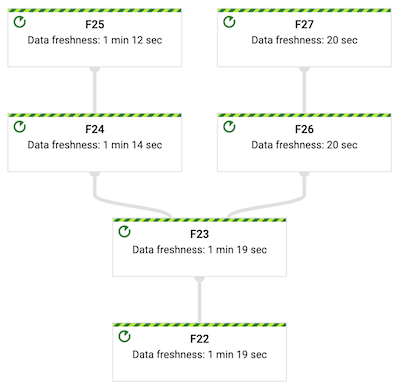
Examine execution graph again.
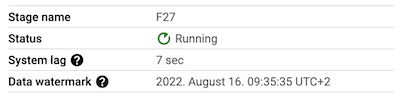
Reported data freshness for step F25 is now 1 min 12 secs
but there is no impact for step F27 where data freshness stays unchanged:
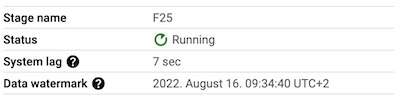
Compare the reported watermarks for steps F25 and F27.
The watermark for step F25 is around minute behind the watermark for step F27:
Finally, examine the results generated by the job by querying BigQuery table:
1
2
3
4
5
6
7
8
9
10
11
12
13
14
15
0: BeamSQL> SELECT
. . . . . >   window_start,
. . . . . >   window_end,
. . . . . >   created_at,
. . . . . >   TIMESTAMPDIFF(SECOND, created_at, window_end) AS delay_secs,
. . . . . >   samples AS no_of_samples,
. . . . . >   ROUND(avg_diff, 2) AS avg_diff
. . . . . > FROM results
. . . . . > ORDER BY window_end DESC
. . . . . > LIMIT 1;
+---------------------+---------------------+---------------------+------------+---------------+----------+
| window_start        | window_end          | created_at          | delay_secs | no_of_samples | avg_diff |
+---------------------+---------------------+---------------------+------------+---------------+----------+
| 2022-08-08 20:07:15 | 2022-08-08 20:07:20 | 2022-08-08 20:08:43 | -83        | 15            | 0.21     |
+---------------------+---------------------+---------------------+------------+---------------+----------+
- Dataflow recognized late data and hold watermark for one of the input stream.
- The results are correctly calculated based on 15 samples from all three sensors.
- Moreover, the oldest watermark is propagated downstream through the pipeline and the overall latency increases.
- The most late source drives the latency of the whole pipeline!
Back pressure and tracking subscriptions
For larger throughput you could also observe, that Dataflow runner slows down the consumption from up-to-date subscription if data in another stream is late. It doesn’t make any sense to allocate job resources for the data received from the up-to-date sensors if the computation must wait for late data. Streaming runner must offer some kind of back-pressure mechanism to align the processing to the data freshness.
How Dataflow is able to estimate data freshness if it stops consuming data due to lateness in another sources? Dataflow creates extra subscription just for event time tracking. For presented SQL pipeline there are four subscriptions instead of two!
![]()
Unfortunately, tracking subscriptions double Pubsub message delivery costs. Even if the timestamp attribute is enough for tracking purposes, you will pay for the whole message delivery.
Missing data
Move to the most surprising part of the blog post.
Stop all generators for stream-2 topic, and watch watermark metric for step F25:
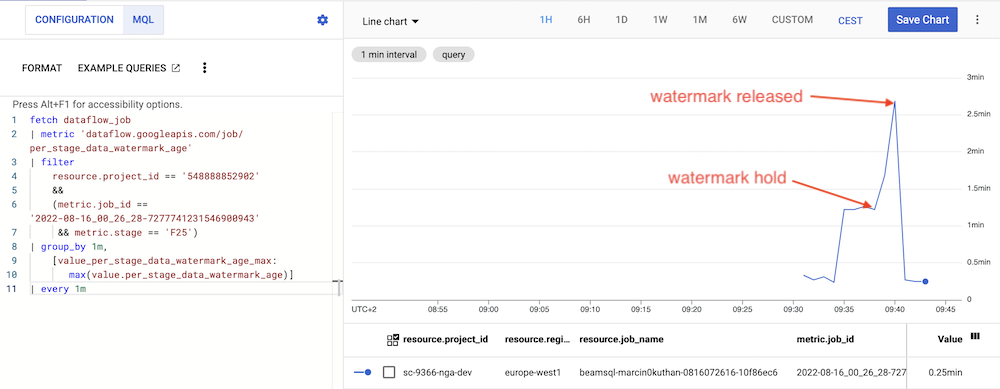
- The watermark of the job is hold on the time of the latest published event in the
stream-2. - But after ~3 minutes the magic happens, the watermark is released again and follow the time of the events in the
stream-1. Data freshness for both streams are the same (~10–20 seconds). - There is no data loss, all sensor readings from the period when the watermark was hold will be calculated perfectly.
If there is no traffic on the Pubsub topic for ~3 minutes, Dataflow assumes that the stream is fully up-to-date and releases the watermark. You couldn’t change this behaviour.
You should observe similar results for the moment when the watermark is released:
1
2
3
4
5
6
7
8
9
10
11
12
13
14
+---------------------+---------------------+---------------------+------------+---------------+----------+
| created_at          | window_start        | window_end          | delay_secs | no_of_samples | avg_diff |
+---------------------+---------------------+---------------------+------------+---------------+----------+
| 2022-08-16T07:38:02 | 2022-08-16T07:36:40 | 2022-08-16T07:36:45 | 77         | 15            | -0.16    |
| 2022-08-16T07:38:09 | 2022-08-16T07:36:45 | 2022-08-16T07:36:50 | 79         | 15            |  0.08    |
| 2022-08-16T07:40:07 | 2022-08-16T07:36:50 | 2022-08-16T07:36:55 | 192        | 14            | -0.26    |
| 2022-08-16T07:40:11 | 2022-08-16T07:37:45 | 2022-08-16T07:37:50 | 141        | 10            |  0.18    |
| 2022-08-16T07:40:11 | 2022-08-16T07:37:10 | 2022-08-16T07:37:15 | 176        | 10            | -0.04    |
| 2022-08-16T07:40:11 | 2022-08-16T07:37:40 | 2022-08-16T07:37:45 | 146        | 10            | -0.26    |
| 2022-08-16T07:40:11 | 2022-08-16T07:37:25 | 2022-08-16T07:37:30 | 161        | 10            | -0.18    |
(...)
| 2022-08-16T07:40:14 | 2022-08-16T07:38:30 | 2022-08-16T07:38:35Z | 99        | 5             | 0.47     |
| 2022-08-16T07:40:14 | 2022-08-16T07:39:15 | 2022-08-16T07:39:20Z | 54        | 5             | 0.31     |
+---------------------+---------------------+---------------------+------------+---------------+----------+
- At
07:28:09the results for the window[07:36:45, 07:36:50)was calculated based on data from all three sensors. - There is a processing time gap to the
07:40:07when Dataflow released the watermark. The total delay is about 3 minutes, 192 seconds to be precise. - From
07:40:11Dataflow has back-filled the gap with data collected fromstream-1andstream-2when the watermark was hold. - From
07:40:14there are only 5 samples fromstream-1, there is no data instream-2. - Don’t expect any order when Dataflow back-fills the results.
The results for window
[07:37:45, 07:37:50)was produced before results for window[07:37:10, 07:37:15).
Complete results from the experiment
You could be a little lost right now, the reasoning about the streaming pipelines is a demanding task 😁 Let me show data visualization for the whole experiment. On the first chart there is a pipeline delay, the difference between results event time and the processing time. On the second chart you can see how many samples were used for calculation.
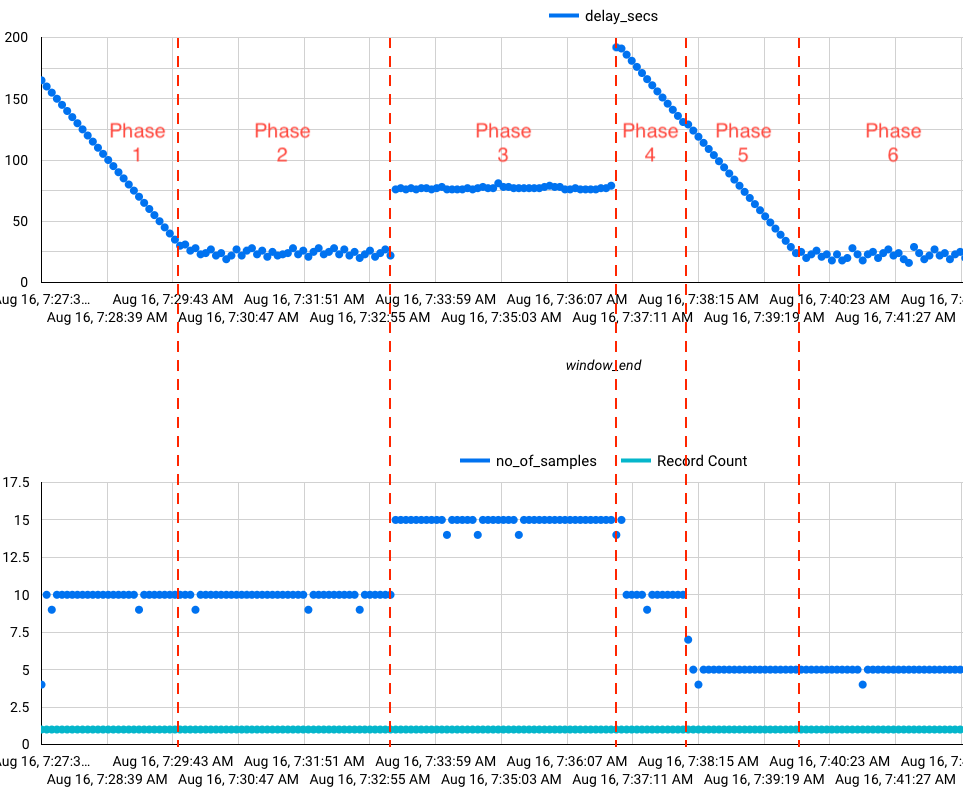
- Phase 1 initial back-fill:
- When Dataflow job starts, it creates Pubsub subscriptions at the very beginning.
- When all Dataflow components are ready, the job quickly consumes all events from the subscriptions.
- The backlog was consumed almost immediately. Try to figure out why the delay is decreasing steadily 😜
- Phase 2 both streams are up-to-date:
- The pipeline latency is almost constant.
- Each window is calculated from 10 samples (5 samples per sensor).
- But sometimes one sample is missing.
Dataflow correctness is 100% but the generator isn’t perfect.
Simple
sleep(1)call between samples isn’t enough to generate exactly one event per second.
- Phase 3 second stream contains late data from the third “phantom” sensor:
- There is additional latency in the pipeline.
- The latency is super constant, it comes from the input data lateness, not from the pipeline technical fluctuations.
- Each window is calculated from 15 samples (5 samples per sensor).
- Phase 4 missing
stream-2back-fill – part 1:- Due to delay of events from third sensor, there is the backlog of events from the second sensor.
- For this phase the results are calculated from 10 samples (5 samples from the first sensor and 5 samples from the second sensor).
- Phase 5 missing
stream-2back-fill – part 2:- There are only events from the first sensor to consume.
- Phase 6 single stream:
- Steady state with events from the first sensor only.
Timeline in processing time domain is also interesting and shows when results are produced:
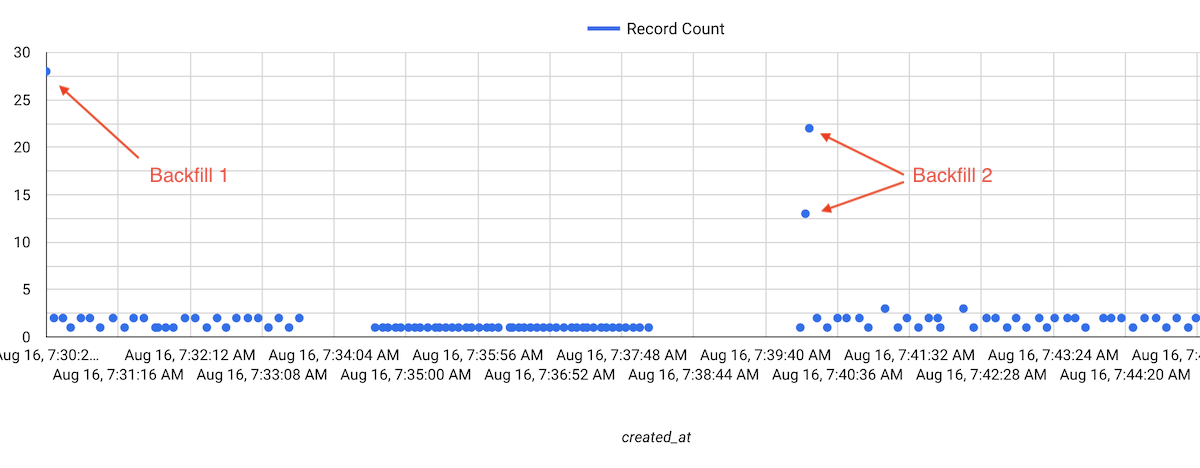
- Initial back-fill finished immediately, all records are produced in the same moment.
- Second back-fill happened when Dataflow released the watermark but this time the records were saved in two similar batches.
Cleaning up
If not specified explicitly, Apache Beam SQL execute job on a single n1-standard-4 worker.
Remember to stop the job after experimentation to avoid unnecessary costs.
1
2
$ gcloud dataflow jobs --project=sc-9366-nga-dev cancel --region=europe-west1 2022-08-07_04_04_14-1079245398928473428
Cancelled job [2022-08-07_04_04_14-1079245398928473428]
Summary
Below you can find a short summary of the blog post and my experimentation with Apache Beam SQL on Dataflow runner. I’ve tried to show some advantages but also point out challenges if you want to run SQL streaming pipeline.
- With Apache Beam SQL you can define a complete streaming pipeline without Java/Scala/Python/Go code. But Beam SQL still has many limitations, you can not specify allowed lateness or define the custom trigger. The documentation is also far from complete and Beam SQL still looks like an experimental SDK.
- Apache Beam SQL shell within Direct runner allows you to prototype the pipeline locally. But for all queries you have to define a query limit to trigger computation materialization when I would expect the unbounded stream of results printed on the console. Even for the tiny throughput don’t expect that Direct runner will be able to run the complete pipeline in the finite time.
- You can deploy the pipeline on Dataflow runner directly from the Beam SQL shell. Convenient method for testing but not for production deployment. I couldn’t manage deployment using gcloud Dataflow SQL query command or DataflowStartSqlJobOperator Apache Airflow operator.
- The Dataflow UI console is amazing, you will get metrics and logs in the single place.
But you have to know how your SQL expression is converted into a logical and physical job execution graph.
Instead of SQL you can only see logical steps like
BeamCoGBKJoinRel_592or physical steps likeF23. - The overall latency of the pipeline is quite good with low overhead from the runner. Dataflow is able to track event time, estimate watermarks and materialize the results as soon as possible. But you have to pay a double bill for Pubsub message delivery due to tracking subscriptions. There is also no control over watermark estimation if there is no data in the stream.
I would recommend to use regular Apache Beam SDK (Java, Python or Go) if you want to run streaming pipelines. Apache Beam SQL looks promising, but it’s a long way to do the first production deployment managed fully by SQL analyst.
Comments